
Livio Di Matteo
Michael Smart
Ontario recently published its 2020 budget, and it contained a lot of bad news. The cash deficit will be around $100 billion over the next three years. This commentary examines options for bringing the province back to sustainability by either reducing spending, raising taxes, or some combination of both. The authors discuss the economic and political consequences of each of the available options, and shows that there are no easy answers for the Ford government.
With its long-awaited 2020 Budget last Thursday, Premier Doug Ford’s government has at last given Ontarians the bad fiscal news. The cash deficit is projected to be $39.9 billion in the current fiscal year (an all-time high), and will remain historically high, around $36 billion and $31 billion, in the next two years.
This is not surprising. While news coverage has focussed on extraordinary spending measures, the real story of Ontario’s deficits is that tax revenue has declined sharply due to the pandemic lockdowns and the ensuing recession, and it is projected to remain below trend for several years to come.[1] With the resulting deficits, Ontario’s net debt will rise to $473 billion and 49.6 percent of GDP by 2022-23.
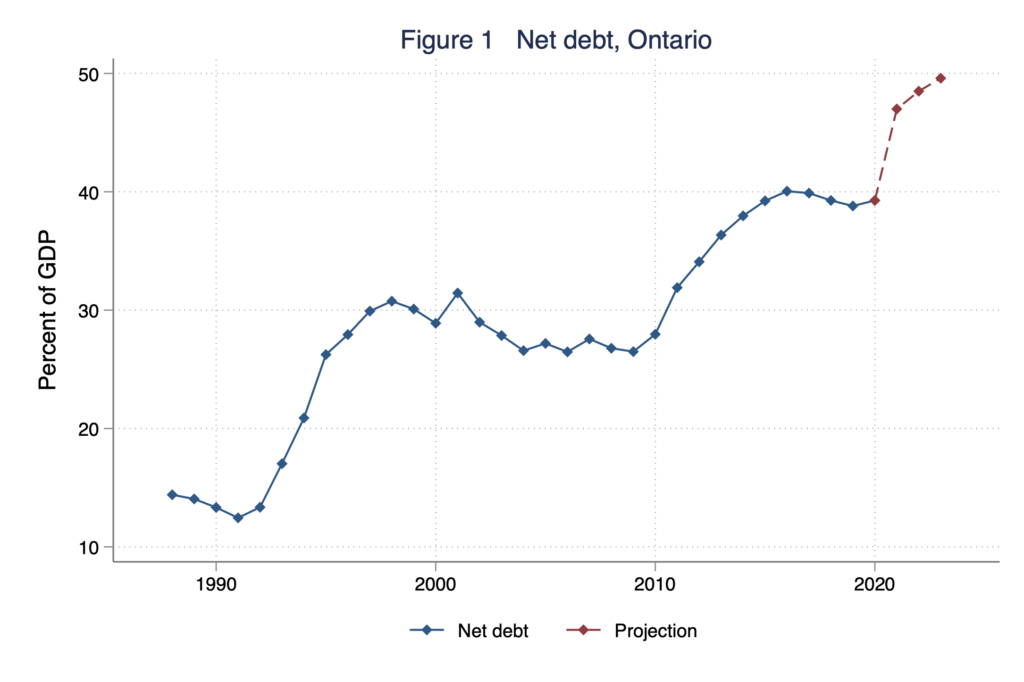
Sobering as these figures are, Ontario is merely continuing on the path it has been on for the last 30 years – see Figure 1. Ontario’s net debt was just 12.4 percent of GDP in 1991, but it rose sharply following the recessions of 1991-2 and 2008-9 to reach 39.9 percent of GDP before the beginning of the current crisis.
Governments must inevitably take on debt during the current crisis and, in the current low-interest environment, it is not irresponsible to carry that additional debt well into the future. That said, the usual concerns about excessive debt are more serious at the provincial level than they may be for the federal government:
- Provinces pay higher interest rates on debt than the federal government, and they already face large implicit liabilities from rising health care costs.
- In a future debt crisis, unlike Ottawa, provinces would not be free to print money or devalue a currency to deal with the problem.
- On the fiscal side too, because tax bases are mobile across borders, it could be harder for provincial governments to raise taxes to meet debt service obligations.
- Lastly, a substantial portion of provincial revenues is not own source revenue, but a transfer from the federal government that is potentially subject to change. That could create political and economic problems during a future subnational debt crisis, just as it has in other countries.
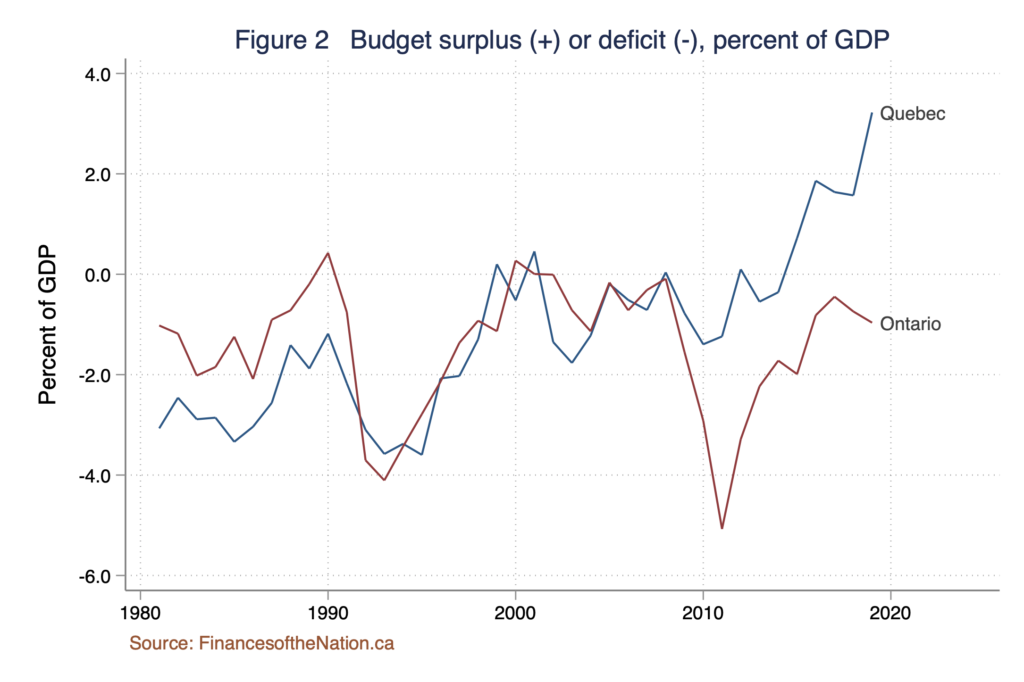
Ontario’s finances are clearly not on a sustainable long-term path, and a course correction is surely coming someday. To learn how that could be achieved, Ontarians need look no further than across the Ottawa River. While Quebec’s budget balances were similar to Ontario’s for many years – see Figure 2 – its fiscal outlook has changed substantially in the last decade. A decade ago Quebec was the fiscal invalid of Canadian federalism, with the highest provincial net debt to GDP ratio. But, more recently, Quebec ran budget surpluses[2] from 2014-15 until the current fiscal year, and its net debt had declined to 39 percent of GDP, from a peak level of 50 percent in 2014.
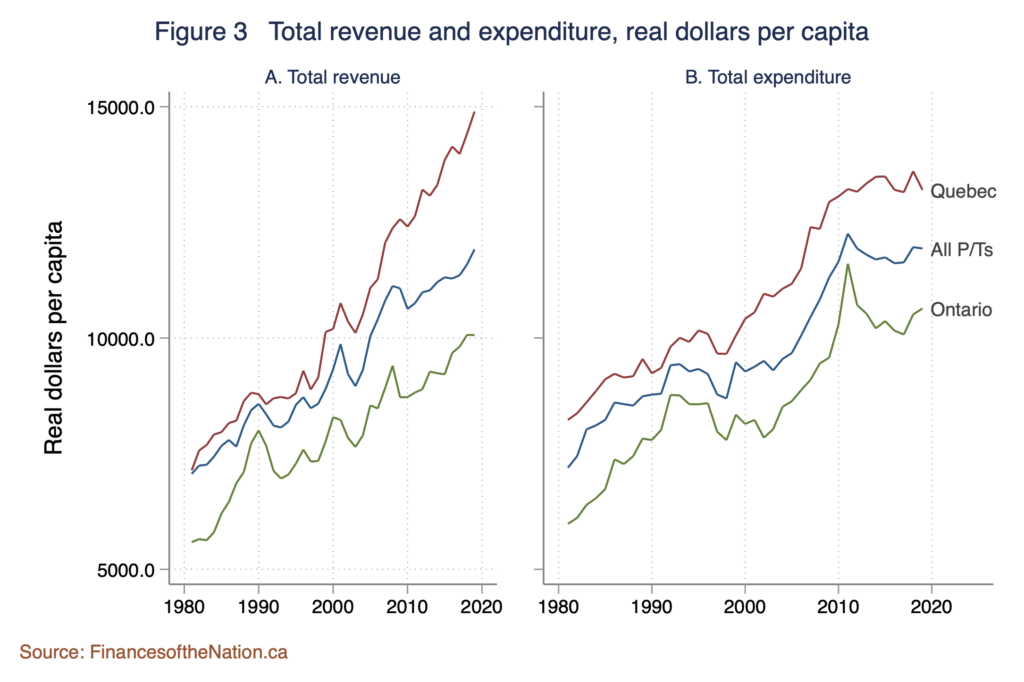
How was this turn-around achieved? Figure 3 shows the history of revenue and expenditure per capita in inflation-adjusted terms, for Ontario, Quebec, and the average of all provinces and territories. Ontario’s spending and revenue have long been well below Quebec’s level. Indeed, compared to other provinces and territories, Ontario has long been a lower-tax, smaller-government jurisdiction.
Moreover, Ontario and Quebec have been reasonably successful at controlling spending growth since the 2008 recession. The biggest difference in trajectory between Ontario and Quebec is mainly on the revenue side of the budget.
Since 2005, while Ontario’s revenues per capita have grown by 18 percent, Quebec’s have grown by 34 percent. In 2018-19, Quebec collected $14,895 in revenues per capita, about 50 percent more than in Ontario.
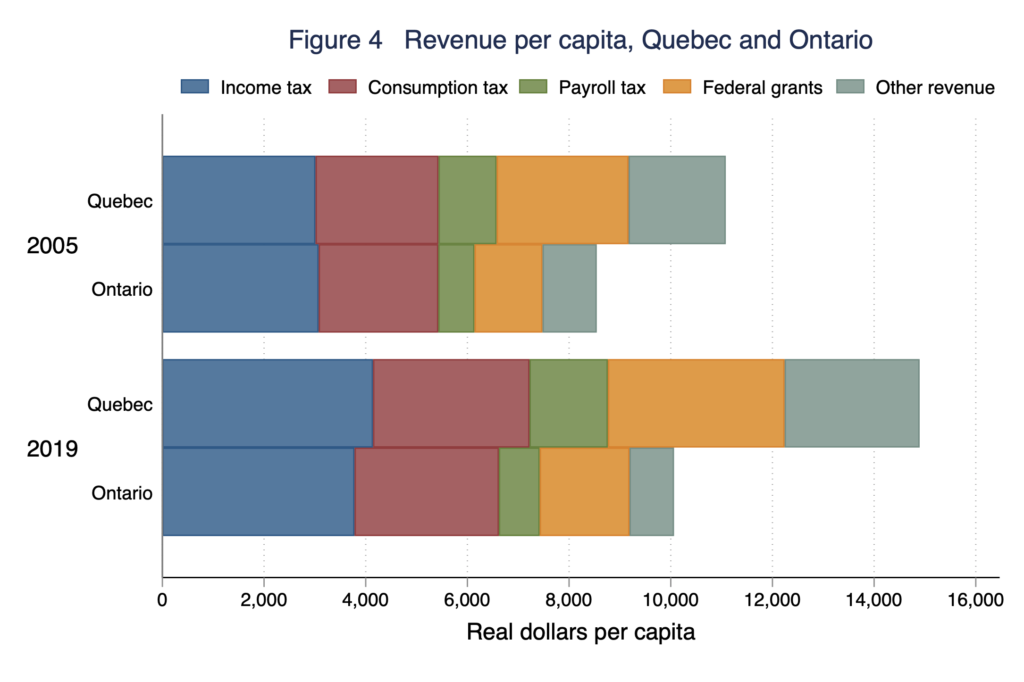
Figure 4 shows this comparison for different components of revenue. Despite lower incomes there, Quebec today collects about 10 percent more per capita in income and consumption taxes than Ontario, and almost twice as much in payroll taxes and social contributions. In addition, Quebec receives substantially more than Ontario in federal grants per capita (mainly through the Equalization program), and in non-tax revenue (chiefly royalties and profits from its hydroelectric sector). As shown in Figure 4, Quebec’s revenues from all sources have increased substantially in real terms since 2005, while Ontario’s have been fairly stable. In all, Quebec’s revenues in 2019 were a remarkable 28 percent of GDP, compared to 17 percent in Ontario.
How did they do it? While part of the reason is Quebec’s higher federal grant revenue, even if Ontario matched Quebec in per capita federal grants, there would still be a significant shortfall. In fact, Quebec’s higher federal transfers explains only about one third of the gap. The main difference is Quebec’s own tax effort. Successive Quebec governments of different political parties have imposed higher taxes. Quebec’s personal income tax rates on the middle class have long been substantially higher than Ontario’s. Sales tax rates have been higher too, since a 2010 reform.
As well, Quebec has employed certain innovative fiscal structures in order to dedicate a portion of its revenue to debt reduction. The Generations Fund was created in 2006 to hold revenue from alcohol taxes and natural resource revenues, as well as a share of annual budget surpluses. Withdrawals from the Fund go to paying down the provincial debt. By 2021, the fund is expected to sit at nearly $12 billion.
The data presented here predate the effects of the pandemic on Ontario’s finances. It should therefore be clear that Ontario has developed a long-term imbalance between its revenues and spending. The general formula for restoring balance is either reduce spending, raise revenues or some combination thereof but there are political and economic pros and cons to all these options. What lessons can Ontario draw from Quebec in achieving more sustainable public finances and bringing down its debt to GDP ratio?
On the expenditure side, while it is always possible to do better when it comes to getting value for money, it remains that Ontario already spends less per capita than the other provinces on its public programs including health and education. Reducing this further via greater private sector involvement in the largest expenditure items – health and education – would inevitably come at a high political cost. Quebec did flatten per capita spending since 2010, but not without protests, demonstrations and strikes.
On the revenue side, there are also challenges. Raising income taxes on the middle class will be a tough sell politically while targeting targeting tax increases at high income taxpayers will not generate much additional revenue – it could even reduce revenue, through its effect on tax avoidance behaviour. While many economists would instead support an increase the provincial sales tax rate, just as Quebec has done, there are again likely political costs. Failing the political will to pursue any of these options, Queen’s Park is left with the alternative of pressuring the federal government for changes in transfer programs that would benefit Ontario.
Quebec’s experience with fiscal consolidation show that where there is a will there is indeed perhaps a way. Will Ontario find that will? That we will see.
1Pandemic-related extraordinary spending will total $21.1 billion, whereas the decline in tax revenue from previous
trend will be more than $40 billion over the three-year planning horizon.
2 The data here report deficits on a cash basis, and are drawn from the Finances of the Nation REAL database , available at https://financesofthenation.ca/real-data/ . Note that the figures reported differ from those in the Ontario Public Accounts, which treat capital investment on an accrual rather than cash basis, and where certain government business enterprises and agencies are excluded from the consolidated revenue and expenditure of the province.