
Introduction
Federal transfers are a perennial issue in Canada, with harsh criticism arising across all provinces and all parties throughout our country’s history.
The equalization program, to take one example, is “perverse and nonsensical” according to former Ontario Liberal Premier Dalton McGuinty, “fundamentally unfair” says Alberta Conservative Premier Jason Kenney, and “is not working” said Saskatchewan Premier Scott Moe.
But it’s not just equalization that raises ire. The entire system of federal taxation and expenditures, which indirectly shifts financial resources across provinces, is often contentious. Alberta’s recent “Fair Deal Panel,” for example, highlighted the gap between what the federal government raises from Alberta taxpayers and what the federal government spends in the province. Ontario also regularly highlights the federal fiscal gap in the province, as numerous research papers from the Mowat Centre over the years can attest.
Who pays and who receives is a central feature of Canadian federalism debates, and has been from the start (for more, read Tax, Order, and Good Government by Elsbeth Heaman).
The intense political rhetoric that sometimes accompanies such debates makes it critically important to understand the data. Luckily, Canadians have access to exceptional annual estimates by Statistics Canada to shed light on these matters. And the latest estimates for 2019 are now out.
As part of Finance of the Nation’s regularly updated offerings, you can download and explore these data for each year from 1961 through to 2019 here.
In this post, I’ll unpack some of the new data and explore where and how federal revenues are raised and spent. We’ll see that despite claims of unfairness by many provincial political leaders, the overwhelming majority of the fiscal redistribution is a consequence of economic conditions and demographics rather than unequal treatment.
Who pays and who receives?
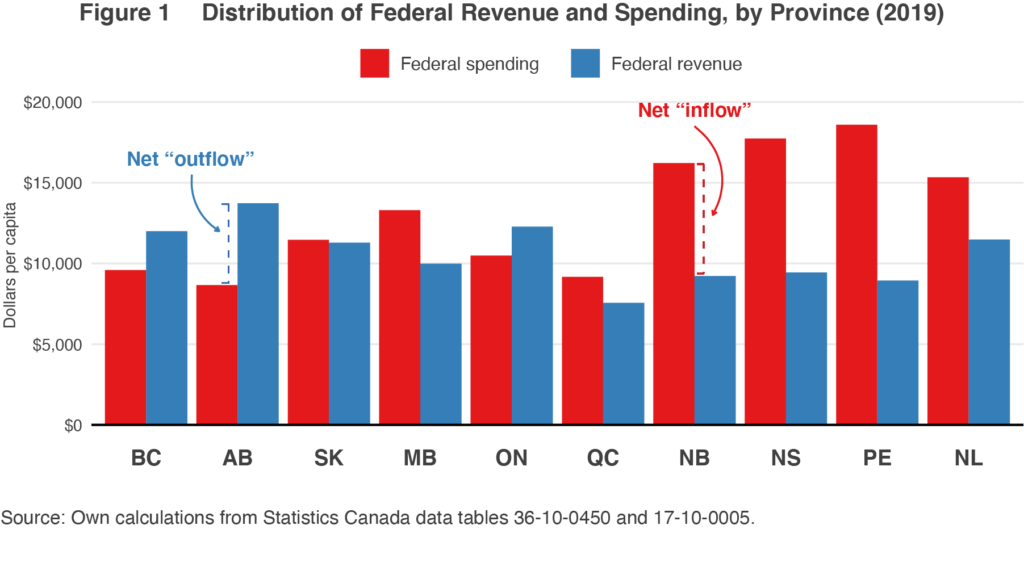
The latest data on federal revenue and spending gaps reveals that in 2019, only three provinces were “net contributors”: Alberta, Ontario, and British Columbia. This means that taxpayers in those provinces send more money to Ottawa than the provinces receive in program spending and transfers. All others experience federal per capita spending levels that exceed per capita federal revenues raised from taxpayers in those provinces, and can therefore be seen as “net recipients.” I plot this in figure 1.
Before unpacking the underlying causes of revenue and spending differences across provinces, it is important to appreciate that the patterns of redistribution are not fixed over time. Some provinces have historically been net contributors only to later become recipients; others, the reverse. In figure 2 I plot a complete series since 1961. (These estimates adjust for aggregate imbalances; see this paper for a full methodology.) The size of the overall redistribution across provinces grows and shrinks with time. In 2019, the equivalent of roughly 2% of Canada’s gross domestic product (GDP) is redistributed across provinces through the federal budget. This is down nearly half since the early 1980s, when redistribution approached 4% of GDP.
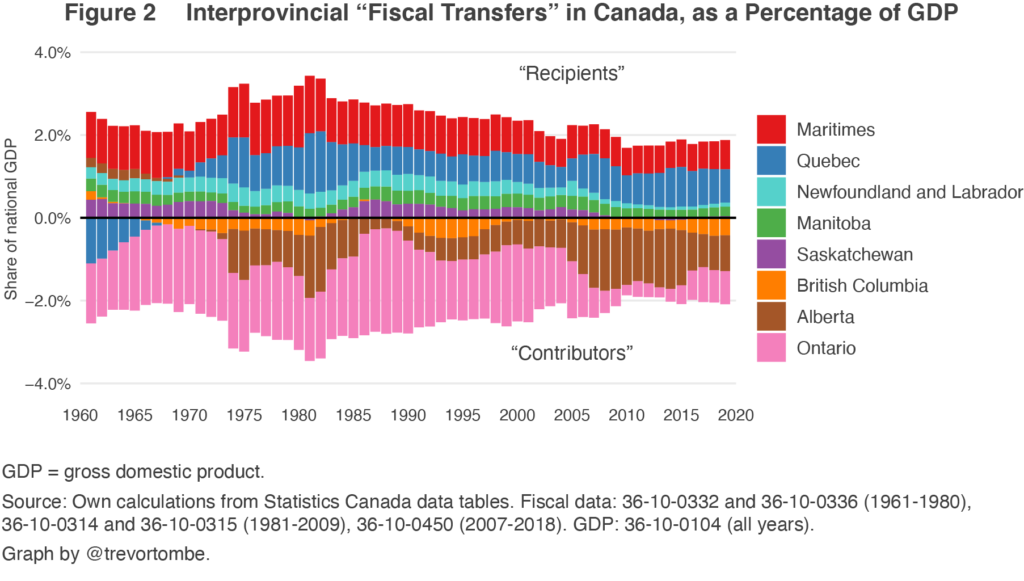
The rises and declines for specific provinces are sometimes significant. Ontario, for example, is historically a large net contributor, but the financial crisis of 2008-09 hit the province and its large manufacturing sector hard. Federal revenues raised from Ontarians fell significantly while federal spending there rose. Ontario even became eligible for equalization payments for a 10-year period starting in 2009-10. In recent years, however, Ontario’s relative contributions have increased as its economy recovers. Notice Alberta’s patterns also rise and fall with economic conditions. High oil prices in the 1970s and early 1980s, and then later in the boom years after 2000, increased labour income and corporate profits significantly. The federal government unavoidably raised more revenues during those times. The opposite is apparent during the difficult times of the late 1980s and early 1990s, as well as recent years.
What’s behind this redistribution?
It’s fairly simple. High-income regions have more high-income individuals and businesses. These individuals and businesses unsurprisingly pay more in income taxes. They also buy more stuff, and therefore pay more in sales taxes and various excise taxes. In addition, higher income regions in Canada also tend to be younger (Alberta especially) and therefore receive fewer payments out of Old Age Security, Guaranteed Income Supplements, and various other income supports targeting elderly individuals. Finally, while high-income provinces generally don’t receive equalization payments from the federal government, poorer ones do. However, as we will see, equalization’s role in fiscal redistribution is often overstated, particularly in Alberta.
Alberta provides a good example of why higher-income provinces wind up sending more money to Ottawa, mostly through their federal taxes. In table 1 I list major federal budget categories that drive the overall imbalances. If a province accounts for an above-average level of revenues per capita or accounts for a below-average level of expenditures per capita, then a “fiscal gap” will exist. Positive gaps mean a fiscal outflow of the province and negative gaps mean a fiscal inflow. For Alberta, most categories are positive.
Table 1 Dollars per Capita Across Federal Budget Categories in 2019
| Budget component | Per capita $ | “Fiscal gap” | |
| Alberta | All provinces | ||
| Personal income taxes | 6,214 | 4,583 | 1,631 |
| Non-defence purchases | 826 | 1,549 | 723 |
| CPP net contributions | 993 | 325 | 668 |
| Equalization/stabilization | 0 | 530 | 530 |
| OAS benefits | 1,063 | 1,476 | 412 |
| GST and excise taxes | 1,918 | 1,666 | 252 |
| Corporate income taxes | 1,782 | 1,588 | 193 |
| Defence purchases | 423 | 582 | 159 |
| EI payments less receipts | 193 | 168 | 24 |
| Child benefit payments | 677 | 642 | -35 |
| All other factors | −3,036 | −2,883 | −152 |
Is this evidence of “unfair treatment”? That depends on your perspective. Notice that GST and other taxes on products account for a fiscal gap of $252 per person. Albertans pay the same 5% GST on goods and services as any other Canadian. But Albertans on average, purchase more stuff, so they pay more in GST. Income taxes paid are similarly higher from Albertans, but not because they face different income tax rates. High incomes naturally lead to higher income tax bills.
These economic and demographic factors are overwhelmingly the primary reason for Alberta’s large net contribution to federal finances. Overall, fully 72% of total fiscal transfers through the federal budget in 2019 are due to Alberta’s high income and young population. Equalization, which receives a disproportionate share of political attention in Alberta, accounts for 12%.
How does Canada compare?
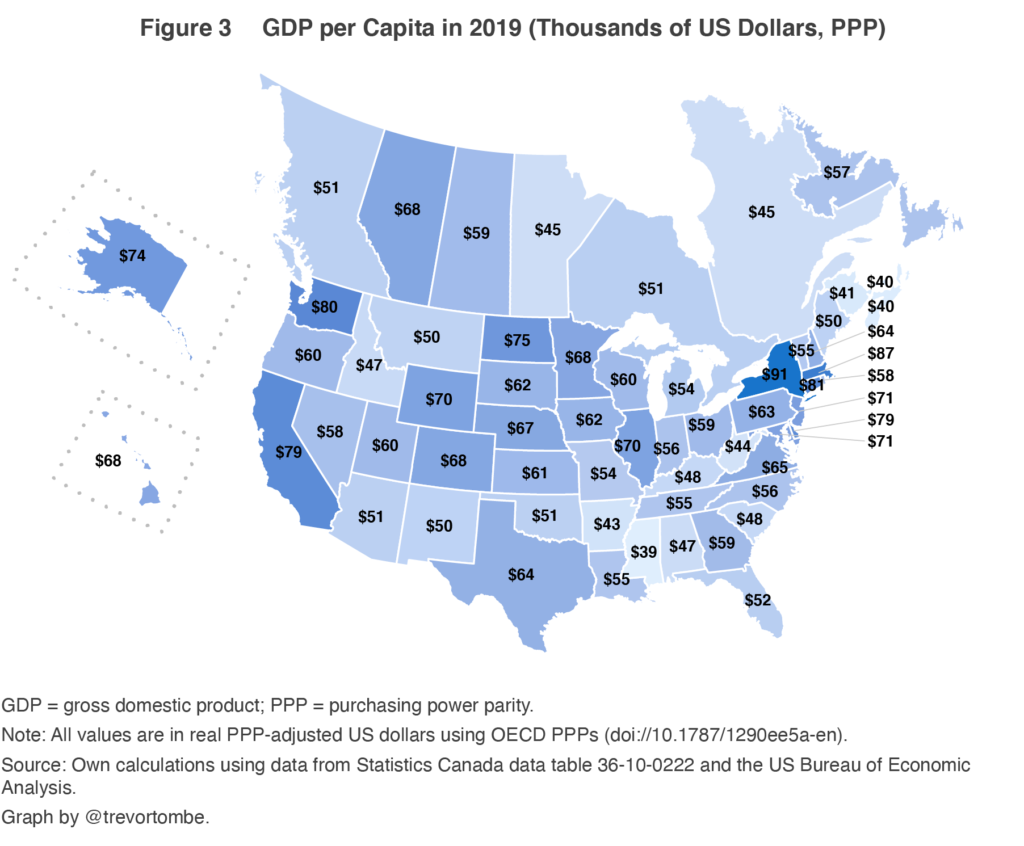
The new data from Statistics Canada also now allow for a full comparison across Canadian provinces and US states. They also reveal that there’s nothing unique about redistribution through a federal budget across regions. Some parts of a country are inevitably higher-income than other parts, as figure 3 makes clear. Alberta’s GDP per capita is 70% higher than Prince Edward Island’s, and New York’s GDP per capita is over 130% higher than Mississippi’s.
(As a quick aside, fiscal imbalances through the federal government are also a source of frustration for New York state officials. They regularly produce analysis on the US “Balance of Payments” (as they call it) to raise awareness of the issue.)
To illustrate how differences in economic strength drive differences in federal fiscal balances, in figure 4 I plot the relative GDP per capita across all 50 states and 10 provinces and the relative amount of revenue each federal government raises from each state or province. High-income regions pay more than lower-income regions. In fact, the relationship between economic strength and federal revenues is somewhat weaker in Canada than it is in the United States.
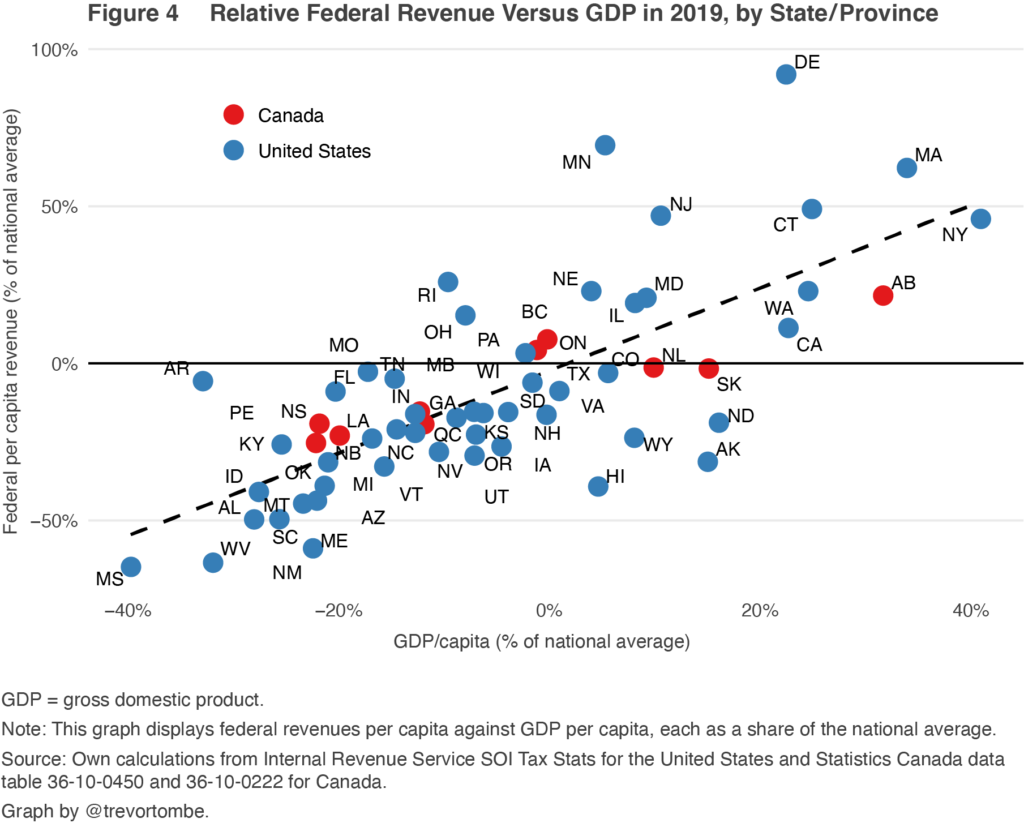
In both Canada and the United States, net fiscal transfers across jurisdictions are largely the result of differences in economic strength and demographics, not unequal treatment by the federal government.
With Albertans set to vote in a referendum on equalization next October, where overall fiscal gaps through the federal budget often (misleadingly) feature prominently in debates, it’s worth keeping these data in mind.
Of course, COVID-19 undoubtedly means massive changes to relative fiscal positions are in store for Canada’s provinces. And as new data or fiscal developments occur, Finances of the Nation will have you covered.