

By FoNBot
The federal government reports monthly revenues and expenses through its Fiscal Monitor. This post summarizes recent developments in the Fiscal Monitor data to help Canadians better understand recent developments in public finances. In addition, we use the monthly data to construct projections for total federal revenue, expenses and the budget balance by the end of the fiscal year. For details behind our forecasting methodology, see Behro, Smart, and Tombe (2021).
This post summarizes the latest information for July 2023, the fourth month of fiscal year 2023/24. All data is publicly available from Finances of the Nation for download here. You can also explore the data using interactive visualizations here.
Revenues
We begin with federal revenues, which have increased significantly in recent years as Canada’s economy recovered from COVID-related disruptions, as well as because of accelerating inflation through much of 2022.
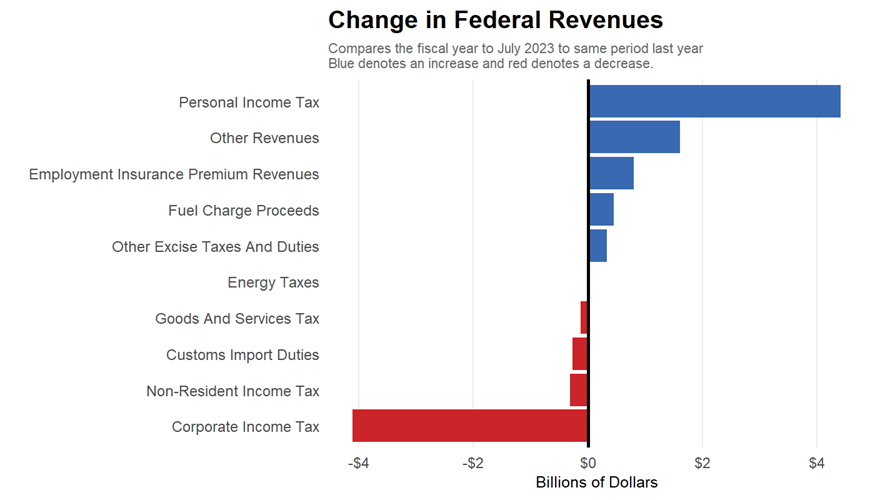
Total federal revenues for July 2023 were $35.4 billion, which is $0.1 billion higher than the same month last year. However, for the whole fiscal year to July, revenues were $146.0 billion, up from $143.1 billion over the same period last year. This change is driven mainly by an increase in personal income tax revenues of $4.4 billion over the fiscal year to date and a $1.6-billion increase in other revenues revenues. These increases were partially offset by a decrease in Corporate Income Tax of $4.1 billion. Below, we illustrate the change in cumulative values for each primary source of federal revenue.
Looking forward, we project total revenues this fiscal year of $438.7 billion, equivalent to approximately 15.6 per cent of GDP. This would also represent an increase of $7.6 billion over last fiscal year’s total revenues of $431.0 billion. (Note that Fiscal Monitor values differ from the public accounts.)
Expenses
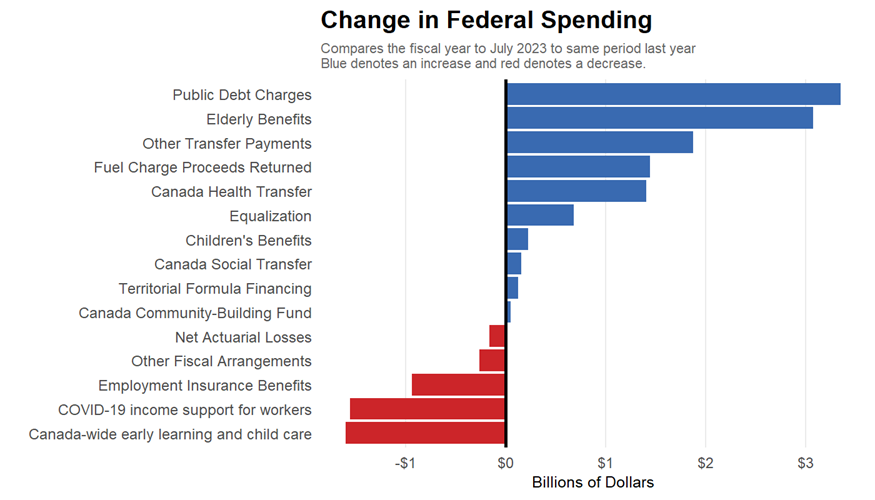
Federal expenses, meanwhile, were $40.2 billion in July 2023, which is $1.1 billion higher than the same month last year. For the whole fiscal year to date, expenses were $147.2 billion, up from $136.8 billion over the same period last year. Increases occurred in public debt charges of $3.3 billion and in elderly benefits of $3.1 billion but these were offset by a decrease in canada-wide early learning and child care spending of $1.6 billion, among other changes. We illustrate the change in major spending categories below.
Another way to examine federal finances classifies expenses by type rather than program. Much of the federal government’s spending, for example, consists of transfers to individuals or other governments. Personnel costs are another large type of expenditure.
- Personnel costs (excluding net actuarial losses) were $5.4 billion for a cumulative $21.3 billion over the fiscal year to date, which is up from $19.7 billion over the same period last year.
- Major transfers to other levels of government were a cumulative $31.6 billion over the fiscal year to date, which is up from $31.0 billion last year.
- Major transfers to persons were a cumulative $37.9 billion over the fiscal year to date, which is up from $37.1 billion last year.
As with revenues, we project forward total expenses for the fiscal year. Specifically, we project $499.1 billion in total expenses (17.8 per cent of Canada’s GDP). Compared to last fiscal year’s total expenses of $472.4 billion, this projection represents an increase of $26.7 billion.
Budget Balance
Finally, the overall balance of the federal budget reflects the difference between revenues and expenses. In July 2023, the federal government experienced a deficit of $4.9 billion. This is a deterioration in the federal budget balance, compared to the same month last year when there was a $3.9 billion deficit. Across all months so far this fiscal year, the cumulative federal deficit stands at $1.2 billion, which is a reduction of $7.6 billion compared to last year.
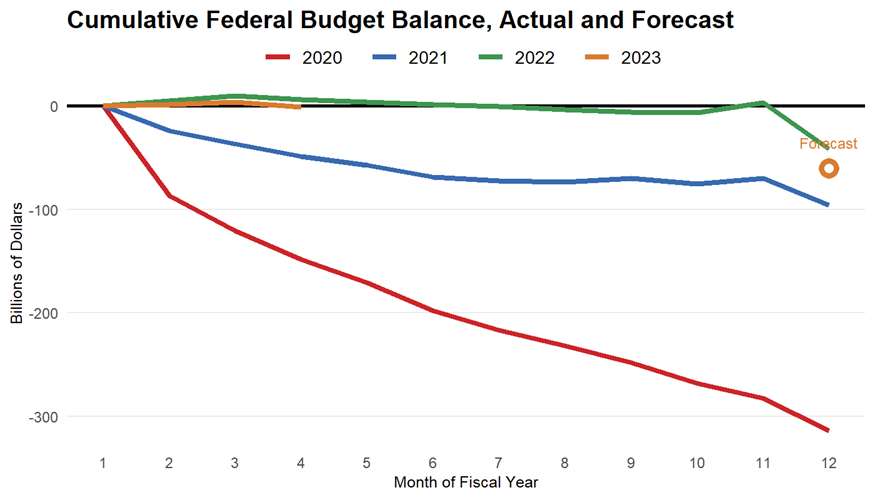
Using our forecasting model, we also project an overall budget deficit this fiscal year of $60.4 billion, equivalent to approximately 2.2 per cent of GDP. We display this projection, along with the cumulative actual budget balances since 2020 below. Our projected budget balance for the current fiscal year is a deterioration from the $41.3-billion deficit recorded in the Fiscal Monitor for 2022/23. By way of comparison, the federal budget last year projected a deficit of $52.8 billion and the Fall Economic Statement updated this to a deficit of $36.4 billion. Importantly, as we noted, the public accounts and budget values do not precisely correspond to the Fiscal Monitor.
The projected budget deficit is $15.5 billion higher than the deficit of $44.9 billion that we projected based on data to June 2023. This change reflects a downward revision in projected revenues of $2.8 billion and an upward revision in projected expenses of $12.7 billion.
Federal Debt
These imbalances between revenue and expenses over time are one important factor affecting the total stock of federal debt. Unfortunately, the Government of Canada has discontinued regular reporting of its debt position in recent fiscal updates. Once those become available once again, the Finances of the Nation bot will update these posts to reflect the latest available data.
Appendix: Our Projection Model
We project revenue and expense to the end of the fiscal year using a distributed lag model estimated by least squares regression on the Fiscal Monitor data since the 1999/2000 fiscal year.
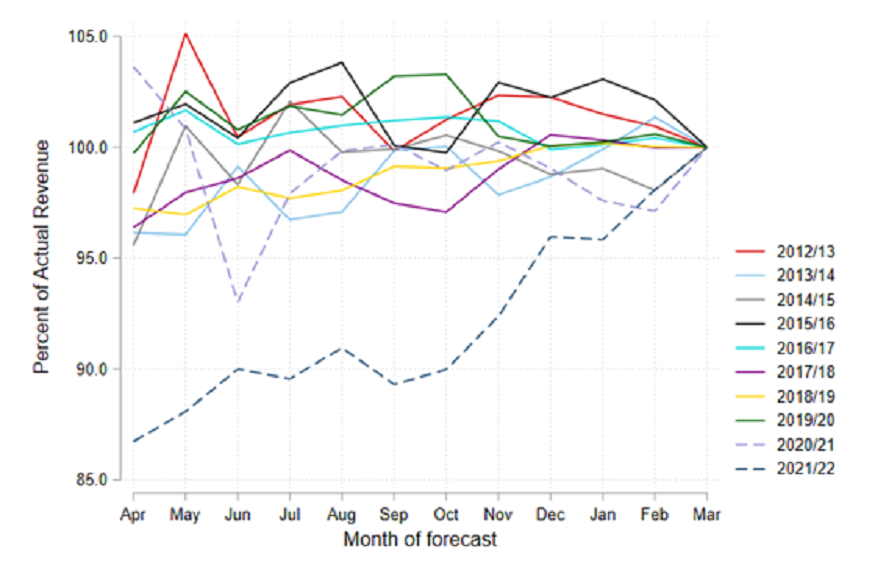
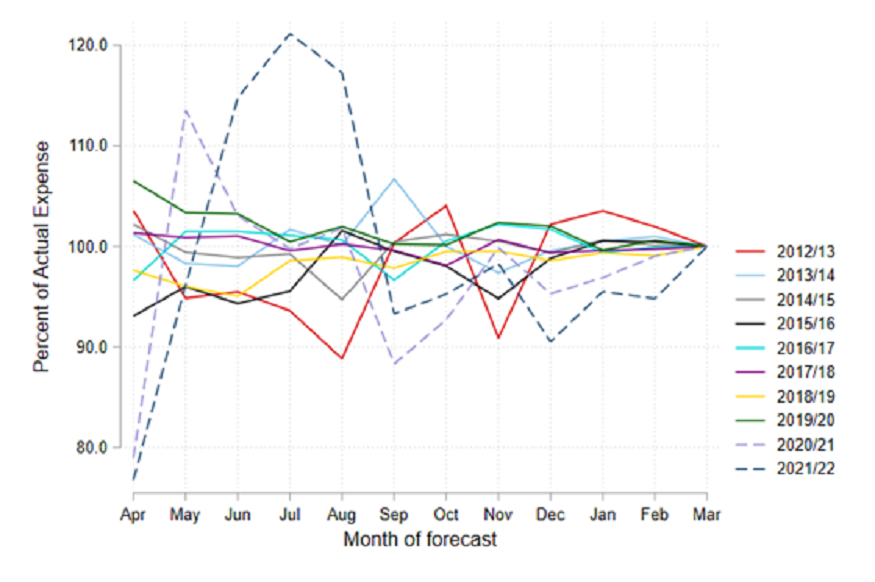
Specifically, we use a rolling forecast window to estimate the forecast for each fiscal year using prior fiscal years. For each month in the fiscal year, we calculate the cumulative total of revenue (expense) to that point and the cumulative total remaining in the fiscal year. We regress the year-over-year change in cumulative revenue (expense) remaining in the fiscal year on its lagged value in the preceding fiscal year, and on the last k monthly revenue (expense) values. We choose k to minimize the mean absolute percentage forecast error over the past 10 years. Our forecast for the current fiscal year and month is then the out-of-sample prediction, using the estimated parameters of the model for the current forecast horizon (month).
As shown in the following figures, mean forecast errors converge towards zero as more months of data become available for the current fiscal year.
Our forecast for the budget balance is the difference between forecast revenue and expense. For more details, see Behro, Smart, and Tombe (2021).
Image credit: Unsplash, Guillaume Jaillet