
Luc Godbout and Suzie St-Cerny
The Canada Workers Benefit (CWB) supports lower-income workers, and recent enhancements have made it more generous. The change also allows for the addition of new beneficiaries, which is particularly important for dual-earning couples. However, the reform also increased the effective tax on earned income for some workers, and therefore potentially lowers the incentive to work. This is especially notable for couples with children where two spouses work. To mitigate this, the federal government could establish a tax shield specific to the CWB, inspired by Quebec’s.
The main objective of the Canada Workers Benefit (CWB) is to make work more attractive to low-income Canadians and to provide them with significant income support.[1]
The federal government’s 2021 budget[2] announced a substantial enhancement to the CWB — increasing its annual cost from $2 billion to $3 billion in 2021.[3] According to the federal government, the CWB enhancement will benefit three million low- and modest-income workers, including one million new beneficiaries.[4] Of course, the CWB has been enhanced for all types of working households. However, the effects of the changes are more significant for couples, particularly with respect to marginal effective tax rates (METRs).
This commentary focuses on the precise effect of the enhancement of the CWB in 2021 for couples. It aims to assess the extent to which the subsidy makes work more advantageous and better supports lower-income workers. To achieve this, we will illustrate the effects of the enhancement on the disposable income of households in Ontario and on their METRs.
Table 1: CWB parameters for couples before and after enhancement, 2021
| Parameters | Before | After | Difference |
| Excluded work income | $3,000 | $3,000 | – |
| CWB Rate | 26% | 27% | +1 pt |
| Maximum CWB | $2,403 | $2,403 | – |
| Reduction threshold (adjusted couple net income) | $17,522 | $26,177 | $8,655 |
| Reduction rate | 12% | 15% | +3 pts |
| Exemption from the maximum work income of the second contributor to be excluded from the adjusted net income used to calculate the reduction | $0 | $14,000 | $14,000 |
Several parameters of the CWB have been enhanced in 2021. Table 1 summarizes the changes for couples.
First, the level of adjusted net income to calculate the CWB reduction is increased. This change is in line with the objective that low-wage Canadian workers who work full-time receive this allowance in whole or in part.[5]
Then, to improve the incentive for the second income-earner to work, it’s now possible to exclude up to $14,000 of work income of the member of the couple with the lowest income, if applicable.
Figure 1: CWB amounts for a couple, before and after enhancement, 2021
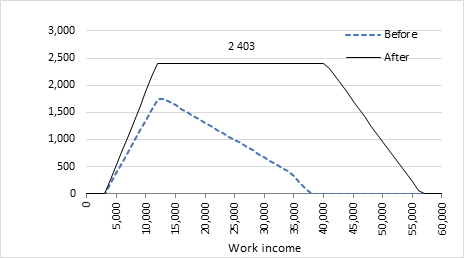
Figure 1 illustrates the CWB as a function of the family income of a couple with children, whose income is divided equally between the two members of the couple. Our definition of households includes two people aged between 18 and 60. When we include children, we use the example where there are two that are of school age for whom no child-care fees are paid. Also, calculations are made assuming that couples receive social assistance benefits when work income is zero and that these benefits are then gradually reduced when labour income increases.
As shown in Figure 1, the CWB rises with income until the maximum benefit is reached. It then remains constant until the reduction threshold before gradually falling to zero.
The figure clearly illustrates that the enhancement has the effect — for a couple with children whose income is divided 50-50 — of postponing the exit threshold by several thousand dollars ($19,000). The introduction of the $14,000 exemption from the second contributor’s work income in the calculation of the reduction explains most of this change.[6]
The CWB increases the income of households that benefit from it and the enhancement made the benefit more generous. It also allowed for the addition of new beneficiaries, as shown in Figure 1.
Figure 2: Disposable income increases from CWB enhancement, Ontario, 2021
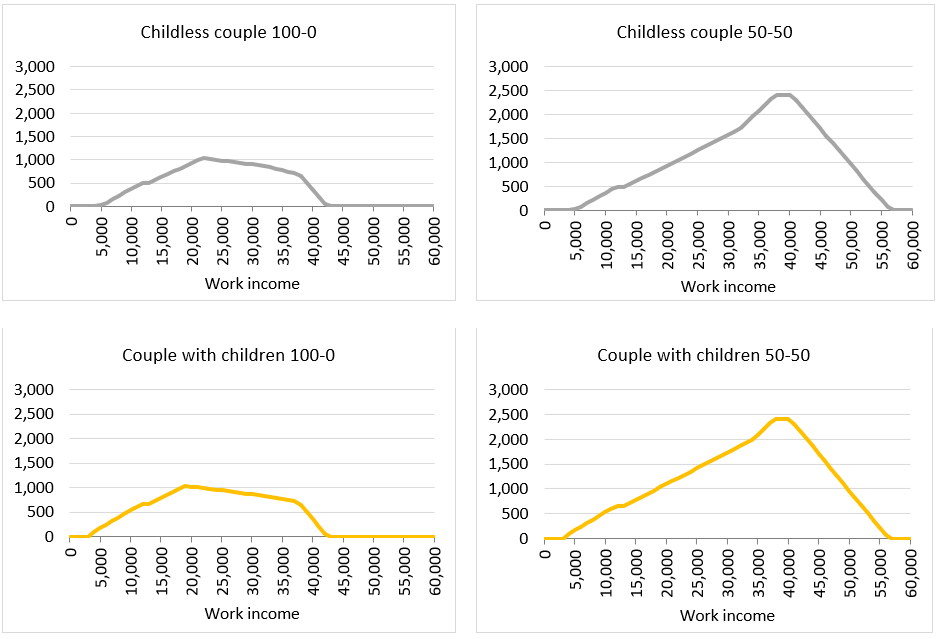
Figure 2 illustrates the effect of the CWB enhancement on the disposable income of couples with and without children, first in the case where only one spouse works (distribution 100-0) and then when the working income is divided equally between the spouses (50-50).
This increase in disposable income is part of the desire to provide support to low-wage Canadian workers. It ranges from $4,000 to $43,000 for a couple where only one spouse participates in the labour market and $4,000 to $56,000 for both spouses to participate in the labour market. In some family income situations, the increase in disposable income is significant. Indeed, it can represent an increase of 3.7 per cent ($1,031 out of $28,069) for the childless couple where only one spouse works and 6.6 per cent ($2,403 out of $36,270) for the childless couple where both spouses work.
The increase in disposable income is similar whether or not the Ontarian couple has children. On the other hand, it’s important to note that the magnitude of the increase in disposable income above the reduction threshold necessarily depends on the distribution of working income in the couple. Indeed, in the case of the 50-50 income distribution, the couple can take full advantage of the possible exemption of the $14,000 of the second contributor’s work income before seeing the benefit reduced.
Table 2: Change in disposable income when switching from one to two spouses in the labour market, for a couple with child, before and after the CWB enhancement, Ontario, 2021
| Single Earner | Dual-Income Couple (70/30) | Change | Retained share of supplementary labour income | |
| Case 1 | ||||
| Family income from work | 28,000 | 40,000 | 12,000 | |
| Disposable income before | 46,368 | 50,322 | 3,954 | 32.9% |
| Disposable income after | 47,263 | 52,470 | 5,207 | 43.4% |
| Effect of CWB enhancement | 895 | 2,148 | 1,253 | +10.4 pts |
| Case 2 | ||||
| Family income from work | 35,000 | 50,000 | 15,000 | |
| Disposable income before | 47,898 | 55,330 | 7,432 | 49.5% |
| Disposable income after | 48,677 | 56,292 | 7,615 | 50.8% |
| Effect of CWB enhancement | 779 | 962 | 183 | +1.2 pts |
| Case 3 | ||||
| Family income from work | 42,000 | 60,000 | 18,000 | |
| Disposable income before | 51,080 | 59,783 | 8,703 | 48.3% |
| Disposable income after | 51,139 | 59,783 | 8,645 | 48.0% |
| Effect of CWB enhancement | 58 | – | (58) | -0.3 pts |
Table 2 measures for three income situations the effect of the CWB enhancement on disposable income in Ontario, to show whether moving from one to two spouses in the labour market will be more advantageous. The first column shows disposable income when only one spouse is in the labour market (100-0) and the second when a second spouse is added. In this case, the work income of this second spouse causes the distribution of work income in the couple to become 70-30. The transition from one to two spouses in the labour market, of course, increases the disposable income of couples in the three cases of income presented.
The retained share of the work income of the second spouse (last column) is significantly increased in Case 1, which may provide an incentive to work, but it must be noted that Case 2 and Case 3 do not really add an incentive to work for the second spouse.
The METR calculates the additional net tax burden (increase in income taxes and social contributions plus lower benefits) for each $1,000 of additional work income. This is an indicator frequently used to evaluate work incentives. For example, if the combination of income tax, social security contributions and benefit losses accounts for 80 per cent of the additional working income, the incentive to work is not very high.
Figure 3: METRs, before and after the CWB enhancement, Ontario, 2021
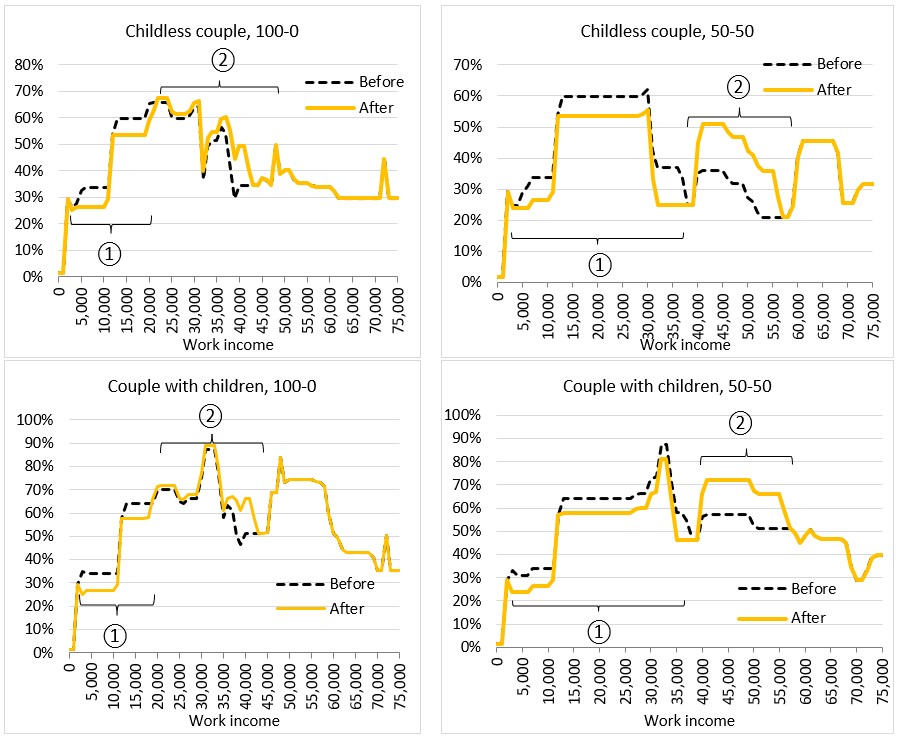
Figure 3 shows that the CWB enhancement first reduces the METRs (1) and then the increases (2) for Ontario couples with and without children for two income distributions (100-0 and 50-50).
From the point of view of work incentives, the decreases are good news and the increases for childless couples lead to METRs that remain close to or below 50 per cent. However, for couples with children, especially those where the distribution is 50-50, the increase in METR occurs in an income zone where METRs were already high. There was an increase in METR from 57.3 per cent to 72.2 per cent. In fact, this increase in METRs is caused by the clawback of the CWB which is added in a revenue zone where the CCB and the GST credit are also in their reduction phase.
Table 3: Distribution of Ontario couples who have an amount of CWB in 2021, by family net income (within the meaning of the federal tax)
| Childless | With Children | |
| $5,000 or less | 0% | 1% |
| 5,001-30,000 | 30% | 32% |
| 30,001-35,000 | 22% | 15% |
| 35,001-55,000 | 47% | 47% |
| Over $55,000 | 1% | 6% |
Statistics Canada’s SPSD/M simulates the number of households that would obtain an amount of CWB in 2021 and ranks them according to their income. Table 3 shows the result of this simulation for couples with and without children by net income. In summary:
- METRs have been reduced when revenues are between $5,000 and $30,000;
- METRs were increased for revenues between $35,000 and $55,000.
For Ontario couples with or without children, it’s possible to see that the highest proportion of households is in the area where METRs have been increased by the change in parameters (47 per cent).
ConclusionThe enhancement to the CWB announced in the 2021 federal budget had a dual objective: to make work more advantageous and to better support lower-income workers. Were these objectives achieved?
While it’s easy to conclude that the CWB enhancement provides an increase in disposable incomes for lower-income workers, the picture is mixed in terms of work incentives.
For lower-income households, the changes make it possible in some cases to increase the incentive for the participation of a second earner, from the point of view of METRs. However, there is a reduction in work incentives for others, such as dual-earning couples with children.
Table 4: Taxes, contributions and benefits of an Ontario couple with two children with split income 50-50, 2021
| Work income | 45,000 | 46,000 | Change +1,000 | METR by component |
| Federal and Ontario PIT | 1,813 | 1,953 | +139 | 13.9% |
| Ontario Health Contribution | 289 | 348 | +60 | 6.0% |
| Social contributions | 2,782 | 2,852 | +70 | 7.0% |
| Total taxes and contributions | 4,884 | 5,153 | +269 | 26.9% |
| Tax Credits (Federal and Ontario) | 1,365 | 1,275 | -90 | 9.0% |
| Child Benefits (Federal and Ontario) | 10,966 | 10,752 | -214 | 21.4% |
| Climate Action Incentive | 600 | 600 | 0 | 0.0% |
| CWB | 1,708 | 1,559 | -149 | 14.9% |
| Disposable income | 54,755 | 55,033 | +278 | |
| Net tax burden | -21.7% | -19.6% | +2.1 pts | |
| METR | 72.2% |
Table 4 breaks down the various components of the net tax burden, disposable income and METR for an Ontario couple with children who have an income of $45,000 divided equally between the two spouses. When their work income increases from $45,000 to $46,000, their METR increases from 57.3 per cent to 72.2 per cent after the enhancement of the CWB. Table 4 also shows an important nuance: although the METR is 72.2 per cent for this couple, the net tax burden is not only low, but strongly negative. Indeed, disposable income ($55,033) exceeds work income ($46,000). However, the government claws back $722 of each additional $1,000 earned.
Here we see the paradox between the two objectives of the CWB. Before the enhancement, this household would not have benefited from the CWB, it would have had a lower disposable income by $1,559, but a stronger incentive to increase its working income (lower METR). After the enhancement, this household is entitled to the CWB, which improves its financial situation, but harms the incentive to work.
To mitigate the effect of high METRs, the federal government should consider setting up a kind of tax shield specific to the CWB, inspired by what exists in Quebec. In the case of the CWB, the parameters would remain the same, but the increase in family work income for the year compared to the previous year would be excluded up to a maximum of $5,000 per individual. Simply put, given the example of the METR and CWB calculation in Ontario, this would mean that the reduction in the CWB would not be calculated on each $1,000 of additional income. In doing so, the METR would then be reduced by 15 percentage points. Compared to the current cost of the CWB, this addition would not impose an excessive burden on federal finances, but would significantly reduce METRs and thereby increase the incentive to work, the primary objective of the CWB.
[1] Finance Canada Insider (2022), Report on Federal Tax Expenditures: Concepts, estimates and evaluations 2022 Page 66.
[2] Government of Canada (2021), Budget 2021, A recovery focused on jobs, growth and resilience.
[3] Finance Canada Insider (2022), op.cit. Page 67.
[4] Budget 2021, op.cit. Page 536.
[5] Budget 2021, op.cit. Pages 133-136.
[6] Figure 1, illustrating the evolution of the CWB for a couple in Ontario, suggests that the maximum increased, but this is not the case. In our cases, the couple is entitled to social assistance. However, in this case, before the bonus, the maximum CWB of $2,403 could never be reached for the same level of work income, given the reduction threshold. It’s therefore the reduced threshold postponed that allows this couple to obtain more CWB.
 Luc Godbout is professor and chairholder of the Chaire de recherche en fiscalité et en finances publiques (CFFP) at Université de Sherbrooke.
 Suzie St-Cerny is a research professional at the CFFP.
The CFFP thanks the ministère des finances du Québec for its renewed support and wishes to express its gratitude for the funding it receives to continue its research activities.
Image Credit: Guillaume Jaillet, Unsplash.