
Livio Di Matteo
In the end, it is not only how much or how little you spend but what you spend it on and what you get for it. Canadian health care is not bad, but it could be better, given the amount of money being spent.
Canada is one of the biggest spenders in the world on health, both per capita and as a share of GDP. Yet, it often appears that there are never enough resources for health care at a time of ever-increasing need.
Long wait times, short-staffed hospitals, problems in long-term-care homes and federal-provincial wrangling over funding models have plagued the sector for years.
COVID-19 has brought many of these problems into even sharper focus – especially the shortage of health professionals in many fields ─ and has confirmed other challenges, such as the fact that Canada has one of the world’s lowest rates of hospital beds per capita.
It was a long road over many decades that got us to this point – and it’s important to understand how this occurred. There is also obvious room for improvement, even if there is not a consensus on what needs to be done.
Action is urgently needed. Perennial provincial demands for more funding and a perceived federal readiness to embark on more health and social spending to “build back better” in the wake of COVID-19 were key issues in the September federal election and they remain on the front burner. In the hospital sector, there was a steep decline in patient visits and surgeries in 2020 due to the pandemic. COVID-19 spending aside, overall spending on health care must now increase to deal with the backlog of medical procedures that were delayed or cancelled due to the pandemic.
The relative restraint in the growth of health-care spending over the last decade may also give way to new spending in areas such as pharmaceuticals ─ especially if new product innovation resumes ─ and long-term care as the population ages. As well, increases in the number of physicians since 2000 have implications for future spending, given their role as gatekeepers to the system. The number of physicians per 100,000 population was relatively flat from the early 1990s to 2005 and since 2005 has risen from 190 per 100,000 to 241 per 100,000 population. (See Appendix, Note 1, for more detail). In addition, broad-based technological change in new health procedures may introduce additional expenditure pressures.
Counterbalancing all this will be the ability and willingness to pay the increased bills. This will be particularly challenging given that forecasts for future economic growth suggest only moderate increases in real GDP at best over the next decade, notwithstanding any immediate post-pandemic rebound.
Health economists and governments should be looking for future solutions to remedy the problems in our health-care system. But first, a key question to answer is this: How did we get to the point where Canada spends as much as it does relative to other countries, yet gets only a mid-level set of outcomes.
Health spending in Canada has been through many phases over the past decades ─ growth, evolution, restraint and change.
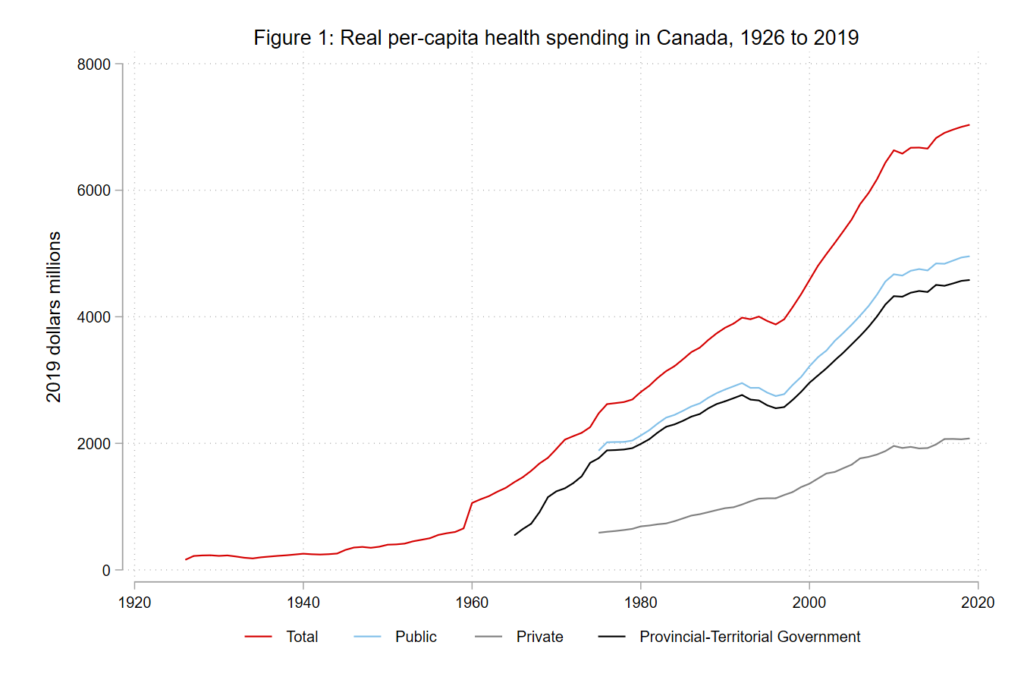
Source: See appendix.
Figure 1 presents Canadian total per-capita health spending in real 2019 dollars for the period 1926 to 2019, together with its breakdown into private and public funding sources, and the component of public funding that came from provincial and territorial governments. Real total health spending in Canada was $1.5 billion in 1926 or $159 per capita and reached a total of $264.4 billion or $7,035 real per capita by 2019. On average through this period, real per-capita spending grew four per cent annually.
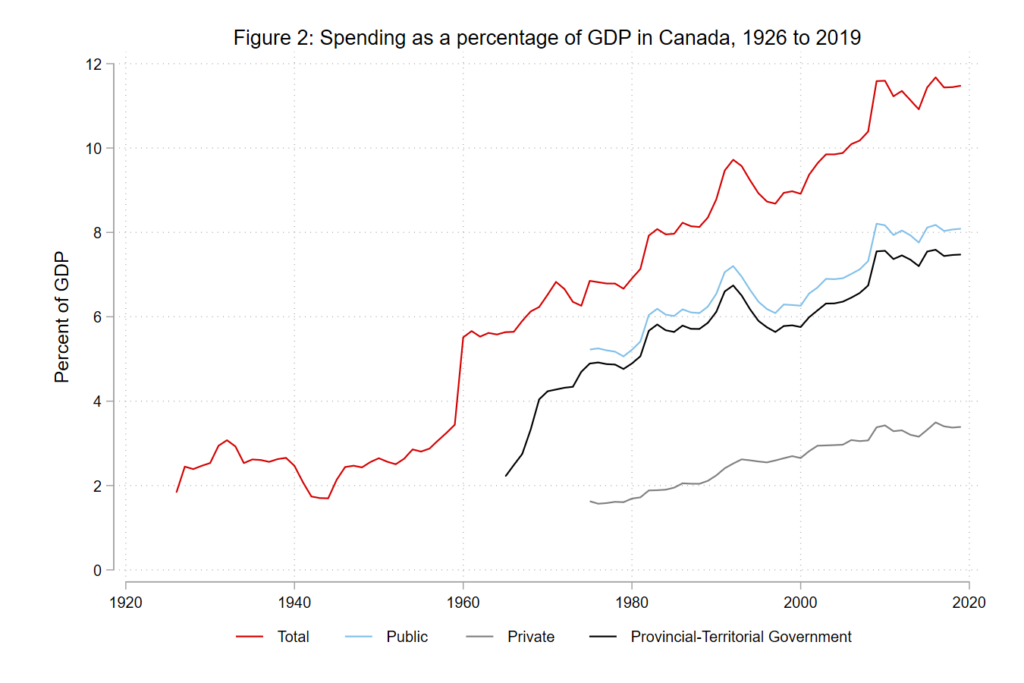
Source: See appendix
To some extent, rising health-care costs have reflected rising aggregate labour productivity and the resulting increase in wages and salaries of health-care workers. Therefore, a better relative measure is the share of health expenditure compared to GDP. As shown in Figure 2, total health spending as a share of GDP grew from 1.8 per cent of GDP in 1926 to an estimated 11.5 per cent by 2019. This growth parallels that of other OECD countries where health-care spending as share of GDP also accelerated in the post-Second World War era. The period 1970 to 2019 saw the OECD average grow to 8.8 per cent from 4.6 per cent. In 2019, the health spending-to-GDP ratio across 37 OECD countries ranged from 17 per cent in the United States to 4.4 per cent in Turkey, with Canada ranked seventh.
Factors driving this growth include:
- rising income (with health spending being highly responsive to increases in income);
- growing and aging populations with associated demand for services;
- technological change with new procedures and diagnostic techniques;
- supplier-induced demand and the rise of defensive medicine by physicians doing excessive diagnostic testing for fear of malpractice suits;
- labour productivity factors and health sector-specific price inflation;
- reduced mortality from chronic disease;
- longer life spans;
- changes in rationing of health procedures and care quality over time by government health ministries;
- financial constraints.
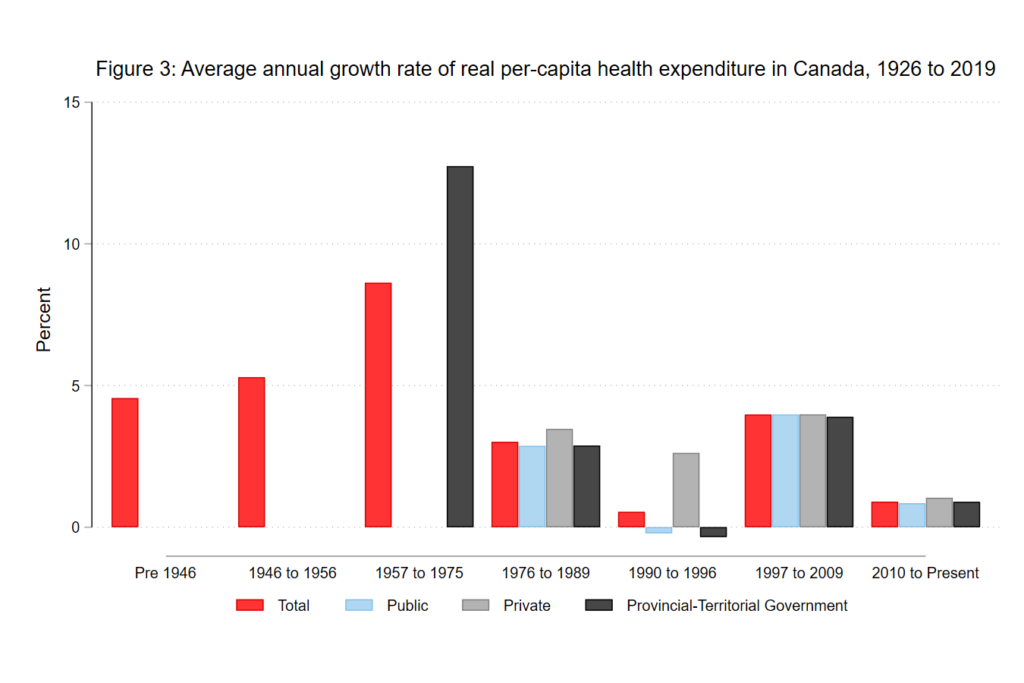
Source: See appendix
Figure 3 shows the average annual growth rates corresponding to eras of differential growth. For real per-capita total health spending, the entire pre-1957 period saw average annual growth rates of 4.6 per cent, with the period from 1946-56 being somewhat higher at 5.3 per cent, reflecting the growing demand for health-care spending during the early post-war economic boom.
The evolution of health spending can be divided into “ages” of differential spending growth rates, each reflecting the main determinants affecting demand and supply for health services. The main drivers are income, population growth and aging, technological change and innovation, cost factors, policy, and government finance. The “ages” of spending can be laid out as: beginnings (pre-1957), boom (1957 to 1975), stabilization (1976 to 1989), decline (1990 to 1996), recovery (1997 to 2009), and renewed restraint (post-2010 to the present). Spending growth was greatest in the boom and recovery eras.
During the boom era, the modern Canadian public health-care system was created with the passing of the federal Hospital Insurance and Diagnostic Services Act of 1957, which provided 50-per-cent federal funding for specified hospital and diagnostic services, and the Medical Care Act of 1966, which extended this funding formula to physician services outside hospitals. By 1971, all provinces were on board and Canada saw annual average growth rates of real per-capita total health spending of 8.6 per cent (12.7 per cent for provincial and territorial government spending.) The early 1970s also saw the beginning of provincial government drug plans for seniors, social assistance recipients and home-care programs.
This golden age of health expenditure growth ended with the energy crisis and stagflation of the 1970s. The radical funding change was the end of 50/50 federal cost-sharing program and its replacement by Established Program Financing (EPF) in 1977. EPF was a cash transfer grant whose future growth was to be determined by an economic growth formula. The end of 50/50 cost sharing was particularly unwelcome on the part of provincial governments, so the federal government attempted to lessen the blow by also surrendering federal income tax points to the provinces. Nevertheless, provincial premiers have considered the federal share of health financing a bone of contention ever since that significant change.
As a result, the growth rate in real per-capita health spending declined relative to the 1957 to 1975 period – though it still rose as a share of GDP — with total real per-capita spending growing at three per cent between 1976 and 1989; provincial-territorial government per-capita health spending growing at 2.9 per cent; and private health spending growing at 3.5 per cent. Provinces responded to the reduction in transfer growth with restraint, leading to a health-care crisis with hospital bed closures, limits on physician billing as well as special charges to patients. Public unhappiness resulted in the 1984 Canada Health Act. By tying federal health transfers to conditions, including public administration and universality, it sought to assure Canadians that medically necessary services would be available to all people, regardless of financial circumstances. There was the prospect of financial penalties for provincial noncompliance, though there has never been a case of financing being withheld.
Federal finances deteriorated in the 1980s as deficits grew and rising interest rates increased debt service payments – one of the factors triggering the federal fiscal crisis of the 1990s in the wake of the 1991-92 recession. The federal government replaced the Established Program Financing grant and the Canada Assistance Plan, which supported welfare services in the provinces, with the Canada Health and Social Transfer, a payment system encompassing health, post-secondary education and social assistance. At the same time, the transfer grant was reduced by approximately one-third, leading to restraint in Canadian health care. The average annual growth rate of total real per-capita spending fell to 0.5 per cent in the 1990-96 period, with provincial-territorial spending declining by 0.3 per cent and private spending growing at only 2.6 per cent. This fuelled concerns about greater privatization in health care.
By the late 1990s, a balanced federal budget, economic recovery and low interest rates generated a fiscal dividend, ultimately benefitting health spending. The catalyst was the Romanow Commission report in 2002 which, among other things, argued for increased federal health transfers to the provinces to encourage transformative change in the health system targeted to rural and remote health, diagnostic services, primary care, home care and drugs. The outcome was the 2003 Health Accord, which introduced a six-per-cent annual growth rate for the cash portion of the new Canada Health Transfer (CHT). This funding escalator was extended in 2011 to 2017, but with an expiry date, at which time increases in funding became the growth rate of GDP, subject to a three-per-cent minimum.
The period from 1997 to 2009 saw more robust health expenditure growth. Whereas public discussion of Canadian health care prior to 2000 focused on restraint, access and increasing privatization of health care, the period from 1997 to the Great Recession of 2008-09 was about sustainability, given Canada’s aging population and the rebound in expenditure growth. From 1997 to 2009, growth rates of real per-capita spending were about four per cent, but this was followed by a drop during the period 2010-19 when real per-capita spending growth across all categories essentially fell to one per cent.
The new era of restraint after 2010 was puzzling, given that annual CHT growth remained at six per cent until 2017. The era of restraint was marked by weakening capital spending and a slowdown in drug innovation and expenditures. It is possible that provincial governments tightened the purse strings on health spending after 2010 in anticipation of the reduction in the growth rate of federal transfers, which they knew was coming after 2017. Yet, there is no guarantee that such restraint will last, particularly now, in the wake of the COVID-19 pandemic.
Along with periodic flareups regarding access to care and service provision, the perennial underlying public policy debates in Canadian health care have focused on the degree of privatization and the fiscal sustainability of the health-care system, with the former linked to fiscal circumstances. In the end, while a function of determinants and historical inertia, public health-care spending is not a behemoth that operates on a course of its own. It can be as sustainable as we want it to be. Sustainability is determined by public preferences and willingness to pay via private or public spending, taxation rates and government willingness to make difficult taxation and expenditure decisions.
Governments have embarked on spending restraint in the past. The expenditure debate often focuses on sustainability and then becomes sidetracked into discussions of who pays for health care: more or less public funding, privatization, or more federal transfers to recapture the bygone era of 50/50 funding. However, none of these is the most important issue and the debate has diverted Canadians from what really matters ─ value for money.
In the end, it is not only how much or how little you spend but what you spend it on and what you get for it. Canadian health care is not bad, but it could be better, given the amount of money being spent.
Appendix
Note 1: Physician Data obtained from Canadian Institute for Health Information. Scott’s Medical Database.
Figure 1: 1926 to 1974 Historical Statistics of Canada Series B504-513; 1975 to 2019f NHEX 2019 CIHI Table B1.1.1 & B.3.1 & B.4.1 & B.2.1; Statistics Canada, CPI, Series V41693271, 1965-1974, Statistics Canada, Public Finance Historical Data, 1965/66 to 91/92, No. 68-512.
Figure 2: 1926 to 1974 Historical Statistics of Canada Series B504-513; 1975 to 2019f NHEX 2019 CIHI Table B1.1.1 & B.3.1 & B.4.1 & B.2.1; Statistics Canada, CPI, Series V41693271;1965-1974, Statistics Canada, Public Finance Historical Data, 1965/66 to 91/92, No. 68-512; GDP, 1926-1959, Urquhart, M.C. (1988) Canadian Economic Growth, 1870 to 1980, Queen’s University Economics Department, Discussion Paper No. 734; GDP 1960 to 2019, Federal Reserve Economic Data (FRED), Series FRED-CANGDPNADSMEI
Figure 3: Author’s calculations with data from Figure 2.