
Alison Dudu, Zeus Eden, Theo Iordache and Nathan McLean
In 2016, the government of Canada introduced the Canada Child Benefit (CCB), a large income-tested transfer to families with children. Our research shows it works well for low-income Canadians but causes a significant decrease in hours worked by secondary earners in middle-income families. We argue the CCB could be better-targeted toward low-income households.
The Canada Child Benefit (CCB) has been hailed as a signature achievement of the Trudeau government since its introduction in 2016, and is credited with reducing child poverty. But, as a means-tested cash benefit, CCB could discourage work incentives too. Work disincentives are a problem, because they could increase the total fiscal cost of the program, and they could weaken its impact on family incomes and child poverty.
We examined how incomes and labour supply changed in families with the introduction of CCB, using microdata from the Canadian Income Survey. While other recent research has examined CCB’s impacts on single-parent families, we focus on two-parent families and the impacts on labour supply of secondary earners within those families.
Under the CCB, the maximum benefit goes to low-income families whose total annual earnings are $30,000 or less. Families with higher incomes also get CCB, but benefits are clawed back as income rises, which could discourage work. As well, higher-income families may have more flexibility to reduce their hours of work when benefits rise. These considerations suggest that higher benefits might discourage work, especially at higher family income levels.
Consistent with this view, our research shows that employment earnings of low-income families did not decrease, and in fact increased, upon receiving higher benefits. In other words, higher benefits directly led to an increase in after-tax incomes for the poorest families. But middle-income families (those where the primary earner earns $30,000 to $65,000 per year) were different. In middle-income families, secondary earners reduced their personal employment earnings, labour force participation and working hours following the CCB reform, our research shows. Thus, the lower earnings of the secondary earner offset the higher benefits received, leaving after-tax incomes unchanged on average in middle-income families.
This may suggest that future enhancements in benefits should be better-targeted to families most in need, rather than extended to families in middle- and upper-income ranges.
How the program works
The CCB represented a significant increase in family benefits, compared to the complex system of benefits previously available under the Universal Child Care Benefit (UCCB), the Canada Child Tax Benefit (CCTB), and the National Child Benefit (NCB). Under the CCB, the maximum benefit of $6,400 for children under six and $5,400 for children ages six to 17 is payable to families with net incomes below about $30,000. At higher family incomes, benefits are phased out (or “clawed back”) at a rate of seven per cent for families with one child, 13.5 per cent for families with two children, 19 per cent for those with three, and 23 per cent for families with four. These clawback rates are added to ordinary federal and provincial income taxes, so that the combined marginal tax rate for families in the clawback range may be very high. Families earning more than $65,000 annually are subject to a separate set of phase-out rates that also increase with the number of children.
Figure 1. Child Benefits over Time
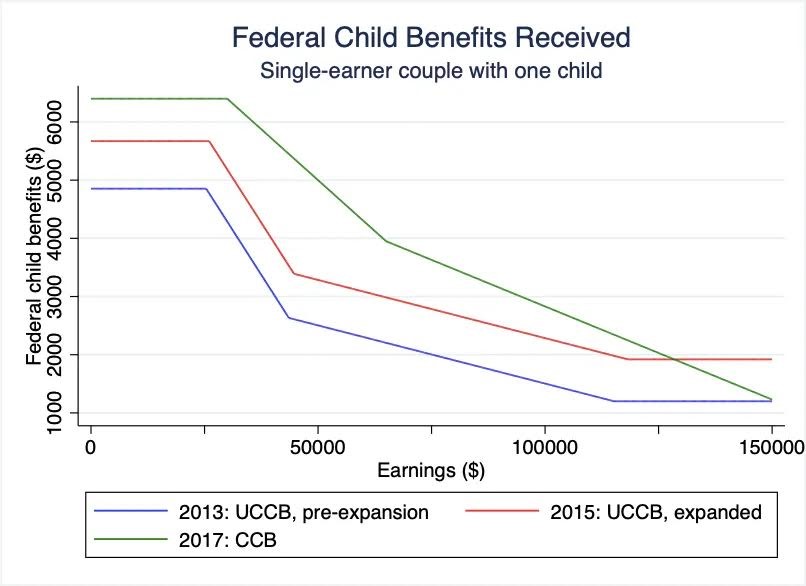
Figure 1 illustrates the benefits and their phase-out rates over a range of earnings for a sample family (a single-earner couple with one child). The green line represents the CCB, while the blue and red lines represent the former Conservative government’s universal child care benefit (UCCB) which it replaced, before and after the expansion the UCCB underwent in 2015.
Figure 1 depicts federal child benefits as a function of family income.
Our research employs a difference-in-differences (DD) research design, comparing two-parent families with children (the “treatment” group) to two-parent families without children (the “control” group). We compare outcomes in treatment and control groups in the baseline 2012-15 period to outcomes in 2017 after the introduction of CCB. Since the CCB was introduced in the middle of 2016, we dropped the 2016 data from our analysis.
Figure 1 shows that the biggest change in benefit levels (red line vs. green line) is seen for families that earn roughly between $30,000 and $65,000 per year. We therefore conducted our analysis separately for families where the primary earner earns less than $30,000 (“low-income families”) and those where the primary earner earns $30,000 to $65,000 (“middle-income families”). We analyze the impacts on secondary earners’ hours and weeks worked (the “intensive margin”), and labour force participation (the “extensive margin.”) We also analyze market and employment incomes and post-tax post-transfer incomes of recipient families.
Figure 2. Effect of CCB on Employment Earnings
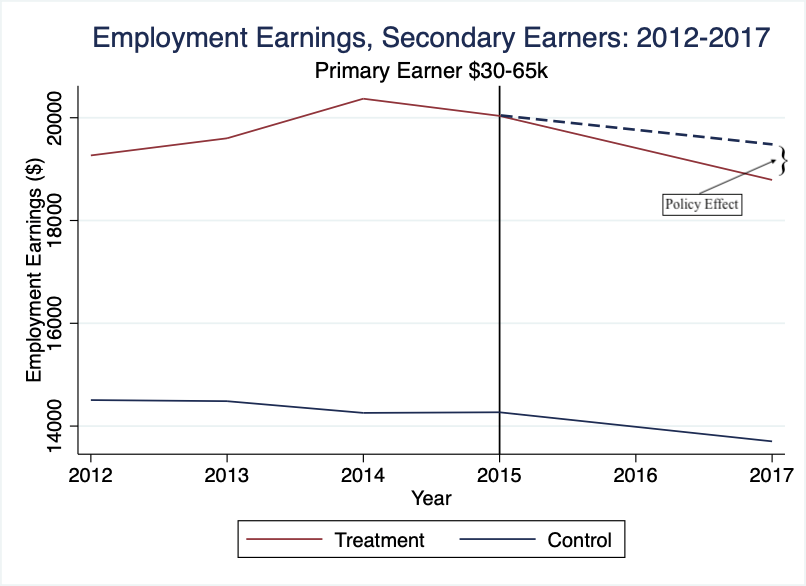
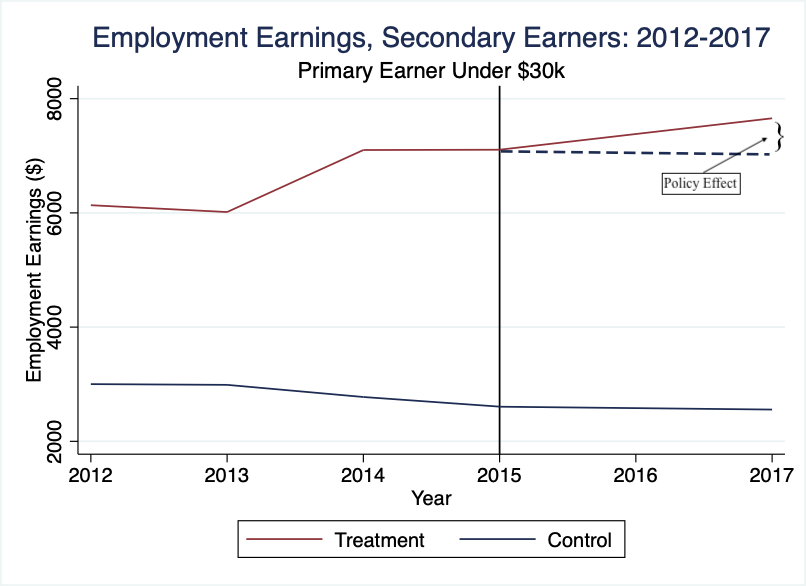
Figure 2 displays the difference-in-differences strategy and our main results. Looking at employment earnings over time for our middle-income group (the upper panel), we see that earnings fall slightly for the treatment group (those with children) following the introduction of the CCB. The dotted line approximates what earnings would have been for families with children, if they had evolved in the same way as earnings for those without children. It is effectively our estimate of what “would have” happened. The difference between the post-period treatment group trend and the dotted line constitutes the estimated impact that the CCB had on employment earnings. Likewise, the lower panel shows the same comparisons for the low-income group. In this group, the introduction of the CCB leads to an increase in employment earnings, relative to the control group.
Holding constant a number of control variables such as demographic indicators (age, sex, education level), number of children and others, secondary earners from middle-income families saw their market incomes fall by roughly $2,800 per year as a result of CCB benefits. This seems largely driven by employment earnings, which fall by approximately $2,300 per year. This is consistent with the classical hypothesis that increased CCB benefits lead to a decline in labour supply. However, secondary earners from low-income families react differently. For them, we observe a modest increase in both market income and employment earnings, by a little more than $1,400 per year.
The results are consistent with our findings on labour hours and labour force participation. On the intensive margin, secondary earners in the middle-income group experience a significant drop in labour supply after CCB implementation, working roughly 100 fewer hours per year. Secondary earners in the low-income group, however, do not experience a statistically significant change in hours worked. One possible explanation is that increased child benefits for this low-income group were used to pay for child care, allowing secondary earners to increase their labour supply while keeping incomes constant.
Labour supply impacts also vary by gender., Women experienced a significant drop in labour supply after CCB implementation, working about 200 hours less per year. Men, however, did not see any statistically significant change in their labour supply. This result implies that the entire observed decrease in labour supply for the middle-income group as a result of the CCB can be attributed to women. These findings suggest that female secondary earners in this category are the most likely (of our entire population sample) to be disincentivized to work due to the CCB. This should be considered when making further policy recommendations.
Similarly, we estimate a decline in labour force participation of 3.77 per cent after CCB implementation for secondary earners in the middle-income group, but no change for those in the low-income group. This further confirms theoretical predictions: implementation of CCB-like transfer payments leads to a decrease in labour supply on both the intensive and extensive margins for secondary earners in the middle-income group. Those in the low-income group, who in aggregate are less likely to have their benefits clawed back, do not see their labour supply decrease.
We also investigated the CCB’s impact on after-tax incomes of secondary earners, which reflects the combined effect of changes in transfers and in market earnings . Examining after-tax incomes is important for understanding the ultimate impact of CCB on inequality and poverty. This is an important dimension by which to evaluate the CCB, because one of its chief goals is the reduction of child poverty nationwide.
We do not see any meaningful change in after-tax income for secondary earners in our middle-income group. However, we observe a rise in after-tax income for secondary earners in the low-income group of roughly $1,600/year. This indicates the CCB did little to modify after-tax incomes for middle-income households, yet had a modest income-boosting effect on households with low incomes. This is a significant result. Both middle-income and low-income households saw their benefits rise by roughly the same amount following the introduction of the CCB, yet these increased benefits led to poverty reduction only for the low-income group. This is because secondary earners in this group did not respond to the policy by reducing their labour supply. In the middle-income group, however, child poverty was not reduced, because secondary earners did reduce labour supply. For them, the CCB effectively acted as a leisure subsidy, dampening its ability to reduce child poverty.
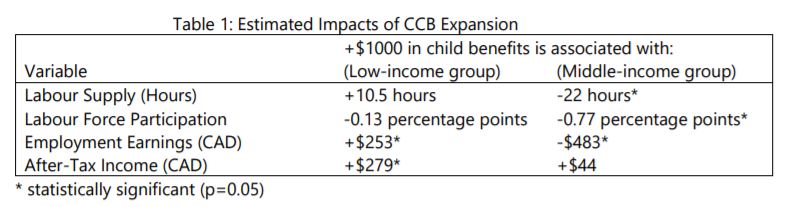
A useful way to summarize our various results is by considering the estimated impact on family outcomes that results from a $1,000 increases in CCB benefits.[1] These “scaled” estimates, presented in Table 1, may be compared to those estimated in other studies, and may be used to simulate the impacts of further expansions of the program.
Is CCB an effective policy?
Our results suggest that CCB has been effective in increasing incomes of low-income families, with little or no disincentive to work. However, the additional benefits paid to middle-income families were almost wholly offset by the resulting decline in labour incomes of secondary earners – which may reflect the income effect of transfers, or the disincentives associated with the clawback of benefits for middle-income families. As Canada moves to introduce a national child-care program, our findings indicate that paying the CCB to middle-income households is both an inefficient way to increase after-tax incomes, and creates a disincentive to work. These results suggest that a retargeting of the CCB to focus more on low-income families would be beneficial.
The authors are recent graduates of the economics program at the University of Toronto.
[1] Formally, these are two-stage least squares or Wald estimates, which divide the difference-in-difference estimates of impacts on outcomes by the associated estimated change in CCB estimates in the relevant treatment groups.