
By Kyra Carmichael, Nicholas Liban Dahir and Kevin Page
In its upcoming speech from the throne on September 23, the Trudeau government is expected to lay out a new economic recovery plan with new spending measures that could add significantly to the budgetary deficit and so to the federal debt.
The new focus on deficit and debt raises come complex issues in public finance. In this commentary, we aim to help Parliamentarians and concerned Canadians become more knowledgeable about these issues through an accessible primer on the concepts, numbers, and policy considerations related to the federal debt.
The Economic and Fiscal Snapshot tabled in Parliament in July provided an update on the fiscal position of the federal government in the midst of their response to the global pandemic. The update indicated that the economic recession and the fiscal supports provided to contain transmission of the virus will result in record increases in the budgetary deficit and federal debt.
Table 1
Federal 2020 Economic and Fiscal Snapshot
Budgetary Balance and Federal Debt
(billions of dollars)
| 2019-2020 | 2020-2021 | |
| 2019 Update | ||
| Budgetary Balance (without risk adjustment) | -25.1 | -25.1 |
| Federal Debt (without risk adjustment) | 711.2 | 736.9 |
| Adjustments | ||
| Economic & Pre-COVID19 Policy Changes | -1.2 | -90.3 |
| COVID19 Policy Changes | -8.1 | -227.9 |
| 2020 Fiscal Snapshot | ||
| Budgetary Balance | -34.4 | -343.2 |
| Federal Debt (1) | 716.8 | 1060 |
| Budgetary Balance (percent of GDP) | -1.5% | -15.9% |
| Federal Debt (percent of GDP) | 31.1% | 49.1% |
Included in the Snapshot were four measures of the debt.
- Federal debt is used in all statements of transactions tables. Prior to COVID19, it was the measure the government used for its medium-term policy rule – a declining debt-to-GDP ratio (e.g., Table A2.4).
- Net debt is a measure used to compare Canada’s fiscal situation with other countries at the general government level (e.g., Chart 2.21).
- Gross debt is a measure used to compare increases in debt relative to income as a result of COVID19 economic and fiscal impacts (e.g., Chart 2.22).
- Market debt is a measure used by the government to explain its borrowing program (e.g., Table A3.2).
Fitch, a global bond rating agency, recently downgraded Canada’s credit rating from AAA to AA+ in June of 2020. This downgrade raised questions about creditworthiness (i.e., the ability to pay back loans and finance more debt) and the sustainability of federal debt (i.e., maintain a stable long-term relationship between debt and GDP).
Fiscal sustainability matters for everyone. Without it, Canada will struggle to create sustainable long-term growth, build strong infrastructure, or support public programs that improve well-being.
Distinctions between these different measures are important in understanding the nature of Canadian federal government debt.
Gross debt (or total liabilities) is the broadest and most intuitive measure of debt. Gross debt includes all liabilities and interest-bearing debt. These liabilities include loans from financing deficits, debts associated with pensions, and other obligations for which the government has to pay principle and/or interest. Gross liabilities are a relatively simple and common measure used to compare fiscal situations of different countries.
- In 2018-19, the last year of published audited financial statement for Canada (2019-20 numbers will be made available this fall), gross debt stood at $1.2 trillion (53% of GDP), including $1,025 billion in interest bearing debt and $160 billion in accounts payable and accrued liabilities.
Net debt is gross debt less financial assets. Financial assets are the most liquid assets held by the government. These assets include cash held in government deposits, receivable money such as taxes receivable, and loans granted by the government. Along with public service pensions, loans, investments, advances and taxes receivable comprise a major share of financial assets.
This net debt measure is arguably a better measure of debt when evaluating ability to repay loans and finance more debt, as net debt considers the ability of the government to convert all their liquid assets to meet their debt obligations. International institutions like the International Monetary Fund (IMF) and bond rating agencies (e.g. Standard and Poor, Moody, Fitch) make use of this measure.
- In 2018-19, net debt stood at $772 billion (35% of GDP) reflecting gross debt less financial assets of $413 billion.
Federal debt or the accumulated deficit is the gross debt less financial and non-financial assets. Non-financial assets are those assets such as land and real estate that cannot quickly be converted to funds to meet debt obligations. As noted, it was the principal measure used by the federal government for fiscal policy (a declining debt-to-GDP ratio over the next five years) prior to the COVID19 pandemic.
- In 2018-19, federal debt or the accumulated deficit stood at $685 billion (31% of GDP) reflecting gross debt less financial assets less non-financial assets estimated to be $87 billion.
Market debt is debt issued by the government on the credit market, like bonds and treasury bills. Often mentioned with market debt is unmatured debt (effectively market debt with some modest adjustments). Market debt is the focus of the government’s debt strategy and a measure used by Parliament to provide borrowing authority to the government.
- In 2018-19, market debt or unmatured debt held by outside parties stood at $737 billion (33% of GDP), including $586 billion in marketable bonds and $134 billion in treasury bills.
Chart 1
Breakdown of Projected 2020 Statement of Accounts
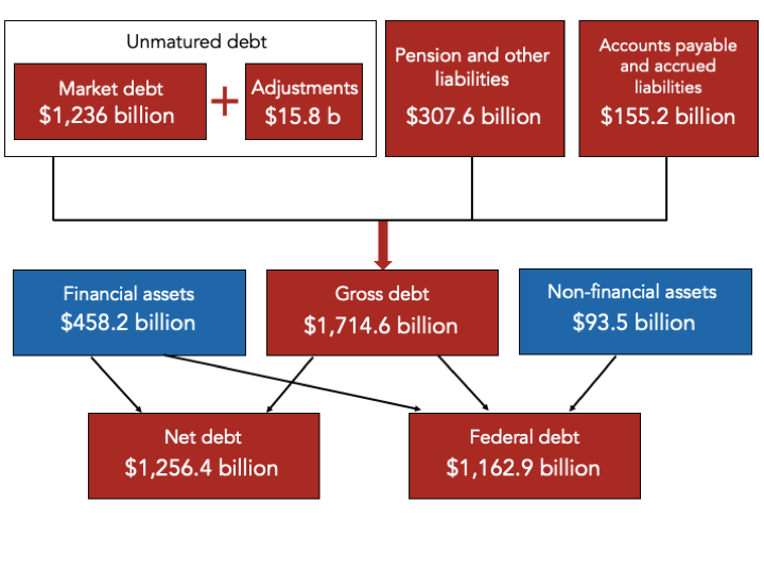
Canada’s gross debt (and market debt) are relatively large numbers compared to net debt (gross debt less financial assets) and federal debt (gross debt less financial and non-financial assets). The sheer size of the numbers is one reason why Finance Ministers of different political stripes tend to highlight them less in budget plans.
The recent downgrade by Fitch (note that S&P and Moody re-affirmed Canada’s AAA status) appeared to place a larger focus on the gross measure of debt. However, the Government of Canada has a lot of financial assets – relative to other countries – reflecting efforts to maintain public service pensions and benefits on a sound actuarial basis. These financial assets provide security against the possibility of default.
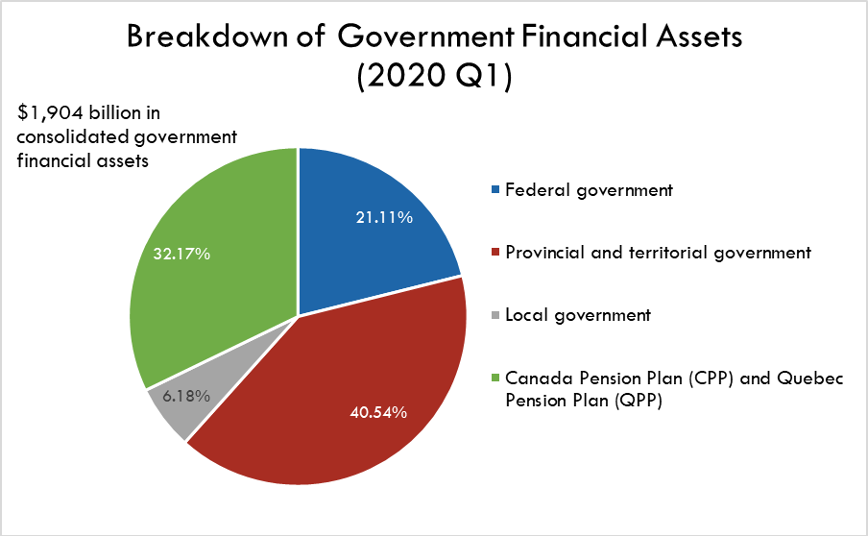
For G7 countries general government financial assets, on average, stood at 49.5% of GDP in 2018. Canada has the most financial assets as a share of GDP of the G7 at 78.7%, except for Japan. Canada’s large stock of financial assets, like Japan, is largely due to pension funds (Canada Pension Plan and Quebec Pension Plan). Canada’s relatively low net debt at the general government level provides Canada with an international fiscal advantage and explains why major some rating agencies give Canada the highest credit rating. Federal debt is not a measure often used for creditworthiness as it considers non-financial assets that the government could not readily liquidate should they need timely funds to address debt obligations.
Chart 2
G7 General Government Net Debt
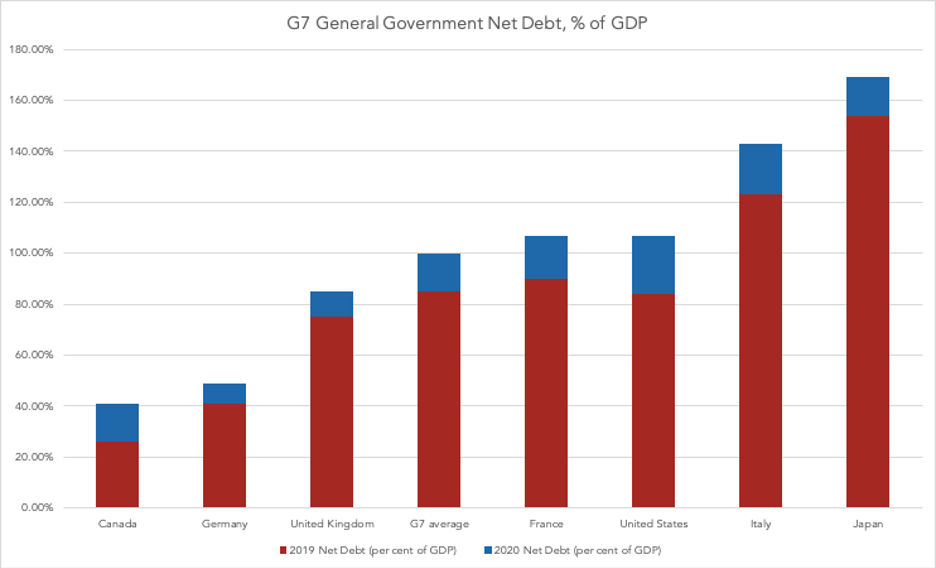
Chart 3
Breakdown of Government Financial Assets, 2020 Q1
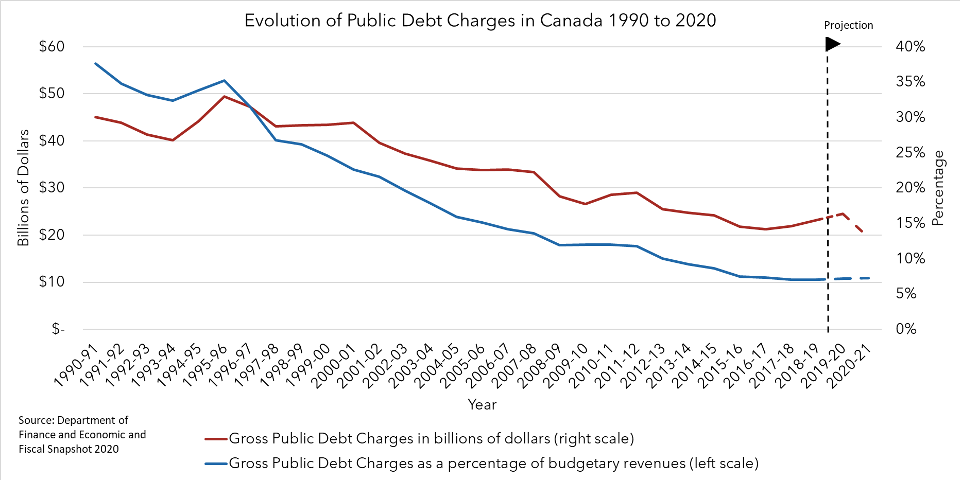
Given this increased level of debt highlighted the 2020 Economic and Fiscal Snapshot, the current low interest rate plays an important role in determining the interest payments the government must pay on debt. During the pandemic central banks all over the world, including the Bank of Canada, have taken monetary policy steps that have seen interest rates reach historic lows. Despite the increase in debt, public debt charges are expected to decline. These debt charges are, however, sensitive to future changes in the interest rate.
Chart 4
Evolution of Public Debt Charges, 1990 to 2020
The upcoming speech from the throne and the next federal budget are expected to be historic. The federal government faces daunting short- and long-term policy challenges which must be addressed while maintaining the sustainability of federal finances. We hope this primer will serve as a useful resource for Parliamentarians and concerned citizens who wish to increase their understanding of public finance in this challenging economic and policy environment.