
Taxes affect how much businesses invest. But the statutory corporate income tax rate, the number most people quote, tells only part of the story. What matters for a new investment is the whole tax system: how quickly firms can deduct the cost of buildings and equipment, whether interest is deductible, what sales taxes apply to capital purchases, and what credits are available.
Economists boil all of this down to what’s called the “marginal effective tax rate,” or METR. Finance Canada publishes estimates from time to time, most recently with the new Productivity Mega Deduction this fall. But the calculations behind those numbers are sometimes difficult to see and understand.
To help, Finances of the Nation is pleased to provide a new Marginal Effective Tax Rate Simulator. It estimates METRs by province, industry and type of asset, under current law or under any changes you want to try. It also traces the METR back to 1980. This post provides a quick tour of the tool.
What is a marginal effective tax rate?
Think of a business deciding whether to build a warehouse or buy a new machine. It goes ahead only if the project earns enough to pay its lenders and shareholders the return they expect. Taxes raise the pre-tax return a project needs to generate in order to justify the investment. The METR measures by how much.
More precisely, it is the share of the pre-tax return that goes to taxes on the marginal project (that is, the project a firm finds just barely worth doing). If investors need a 4.5 per cent real return, and taxes mean the project must earn 4.8 per cent before tax to deliver it, then the METR is (4.8 − 4.5) ÷ 4.8, or about 6 per cent.
This can be very different from the statutory rate. The combined federal and provincial corporate income tax rate in Canada averages about 26 per cent. But since most new machinery and equipment can now be written off right away, for example, the METR on new investment is much lower. It can even be negative.
What the tool shows
When you first open the simulator, it shows current law, including the Productivity Mega Deduction for property acquired from September 15, 2026. The blue bars are the METR in each industry. The black markers show what the METR would be without the Mega Deduction, and the orange diamonds are Finance Canada’s estimates for the United States.
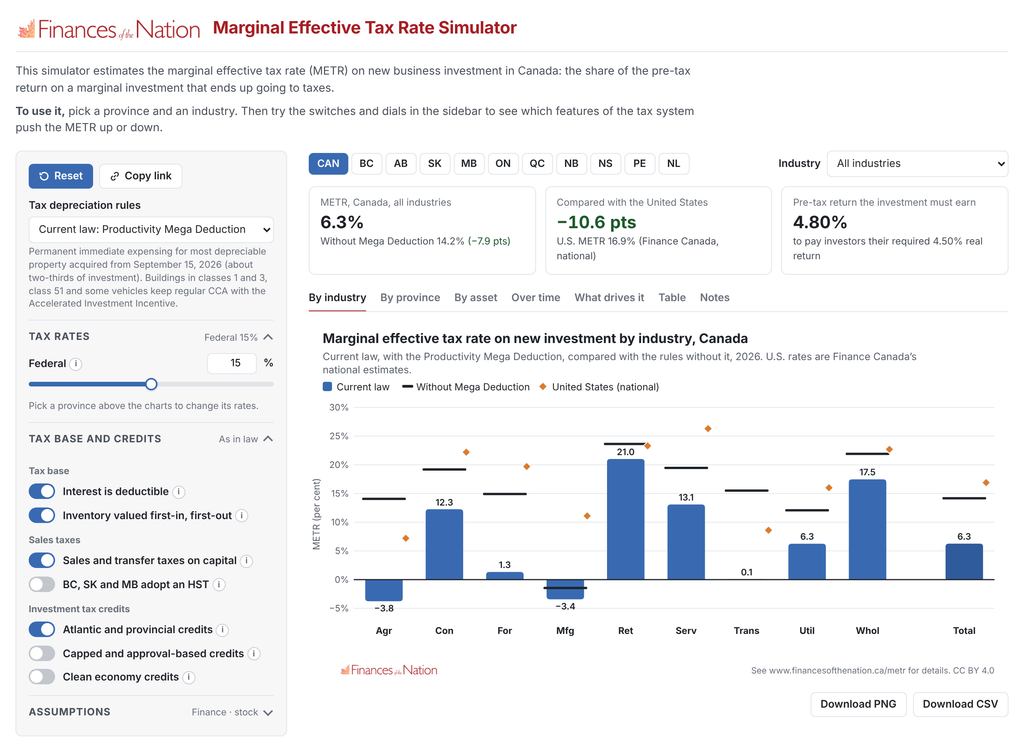
For Canada as a whole, the METR is 6.3 per cent under current law. Without the Mega Deduction it would be 14.2 per cent. Finance Canada’s estimate for the U.S. is 16.9 per cent.
The differences across industries are large. Manufacturing and agriculture have negative METRs, since most of their equipment is now expensed. Retail and wholesale trade face the highest rates, at 21.0 and 17.5 per cent, because much of their capital is inventory and land, which get no faster write-off at all. The three boxes at the top summarize the selection and compare it with the United States.
How to use the simulator
Start by picking a province from the row of buttons above the charts, and an industry from the drop-down menu. The tabs below show the results by industry, by province or by type of asset (buildings, engineering structures like pipelines and roads, machinery and equipment, inventory and land).
The sidebar on the left is where you change the tax system:
- Tax depreciation rules switch between current law, the rules without the Mega Deduction, regular capital cost allowance with no special incentives, full expensing of everything, and write-offs that match true economic depreciation.
- Tax rates let you set the federal and provincial corporate income tax rates.
- Tax base and credits turn individual features on and off, such as interest deductibility, sales taxes on capital, and provincial investment tax credits.
- Assumptions cover inflation, interest rates, the debt share of financing, and whether to measure the METR the way Finance Canada does or the way the OECD does.
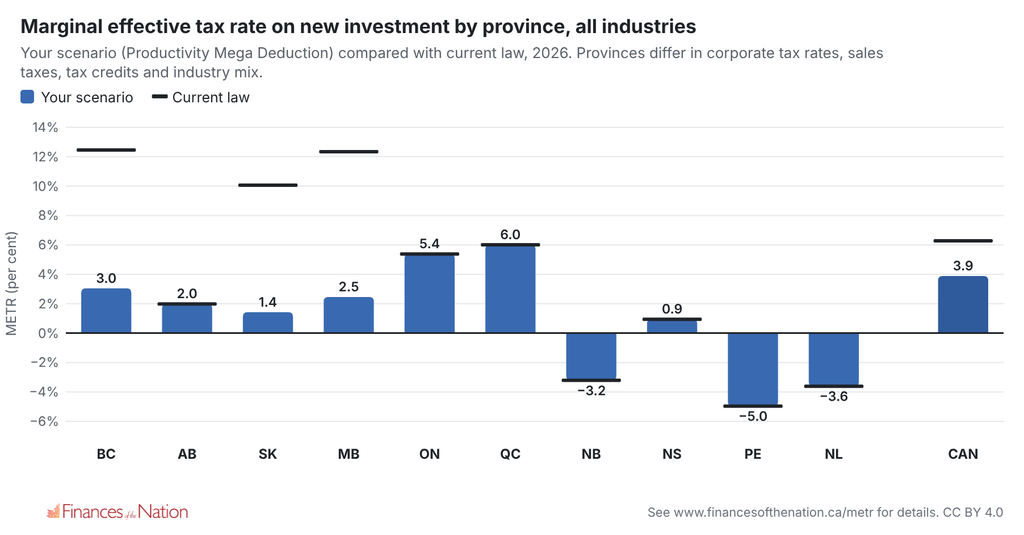
Once you change any tax setting, the blue bars show your scenario and the black markers switch to current law, so you can see the effect of your change directly. For example, BC, Saskatchewan and Manitoba still charge retail sales taxes on many business inputs, including machinery and building materials. Flip the switch that has them adopt an HST instead, and their METRs drop by roughly 9 to 10 percentage points.
Every switch has a small “i” button with a short explanation. You can copy a link to any scenario you build, and download any chart as an image or its data as a CSV file.
What drives it
To understand why the METR is what it is, the “What drives it” tab builds it up one piece at a time. It starts from a tax on pure economic profit, where the METR equals the statutory rate (26.1 per cent for Canada), and then adds each feature of the real tax system.
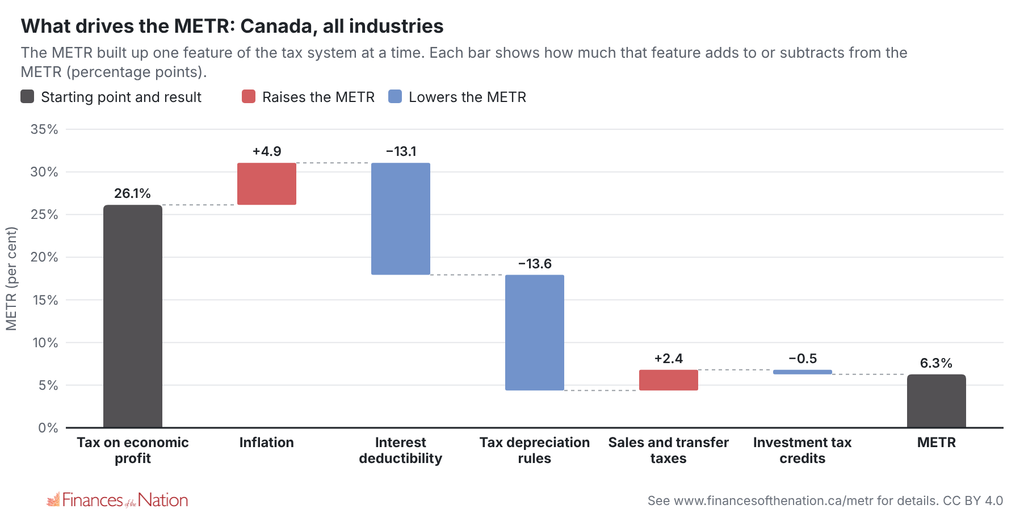
Inflation pushes the METR up by 4.9 points, because write-offs and inventory costs are based on what firms originally paid, which inflation erodes. Interest deductibility then pulls it down by 13.1 points, and fast write-offs under current law cut it by another 13.6 points. Sales taxes on capital add 2.4 points and investment tax credits take off half a point, leaving 6.3 per cent.
The order matters here. Each step is measured with the earlier ones already in place, so a different order would split the total differently.
How the METR has changed since 1980
The “Over time” tab applies each year’s federal and provincial tax law to the same model, back to 1980. That includes not just corporate tax rates but also changes to capital cost allowances, investment tax credits, capital taxes and sales taxes.
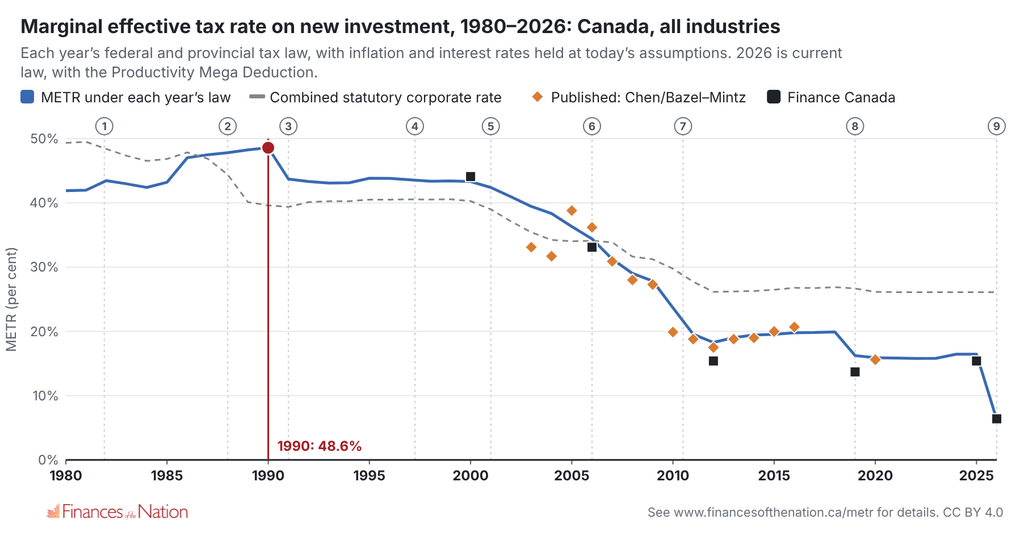
The METR on new investment in Canada peaked at about 49 per cent in 1990. The 1987 tax reform cut corporate tax rates but also eliminated most investment tax credits and the two-year write-off for manufacturing machinery, and the old federal manufacturers’ sales tax was still in place. The METR fell to about 43 per cent by 2000, 24 per cent by 2010, 16 per cent by 2019, and to 6.3 per cent today. Finance Canada’s own estimates, shown as black squares, follow a similar path.
Click any year on the chart (or pick it from the menu) to see what has changed since then. Since 1990, the biggest single factor has been sales taxes. The GST replaced the manufacturers’ sales tax in 1991, and most provinces later moved to value-added sales taxes that refund tax on business inputs. Together, these explain almost 20 points of the decline. Faster write-offs, lower corporate tax rates and the end of capital taxes explain most of the rest.
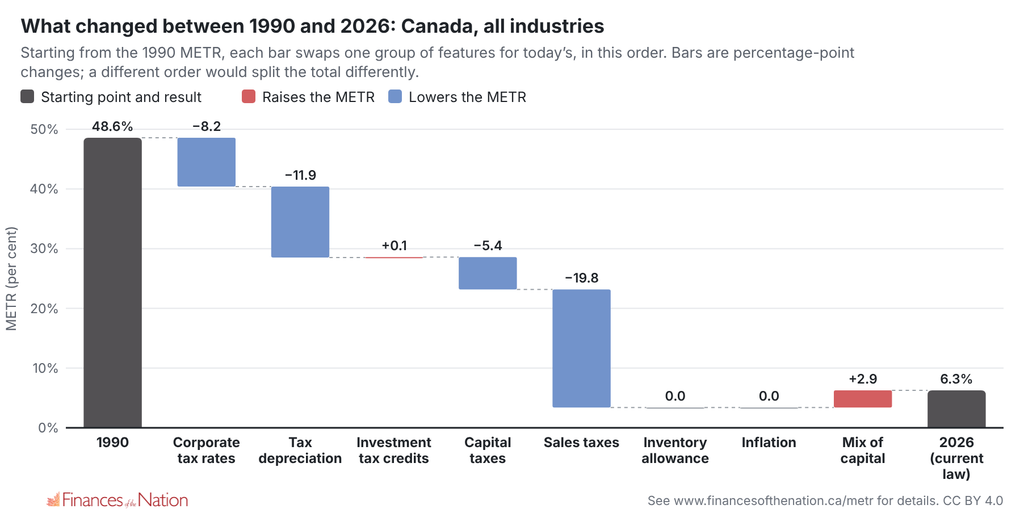
Hover over any bar for a short note on what changed.
Some caveats
The simulator is mainly an educational tool. It follows the same basic approach as Finance Canada and others, and its results come reasonably close to theirs. Finance estimates a METR of 13.0 per cent without the Mega Deduction and 6.4 per cent with it; the simulator here gets 14.2 and 6.3, respectively. But Finance does not publish all of its inputs, so some of the ones used here are approximations, and results for individual industries and provinces differ by more.
Like all METRs, these estimates also come with limits. They describe a taxable firm making a marginal investment, so they say little about firms with losses or projects earning large profits. They leave out personal taxes and municipal property taxes. And they exclude mining, oil and gas, finance and real estate, as Finance Canada’s estimates do.
The Notes tab explains the method, data and assumptions in more detail. All results and charts are free to use under a CC BY 4.0 licence. If you find something that looks off, or have ideas for what to add next, please get in touch.