
Introduction
There is perhaps no federal program that raises the ire of provinces as regularly or as fiercely as equalization.
From its beginnings over a half century ago, equalization sparks often heated debates about fairness and equality in Confederation. Recent concerns are loudest in Alberta — where a referendum this year on equalization’s place in the constitution — but are not unique to that province. “Fighting for Fairness”, for example, was a core element of the Newfoundland and Labrador PC Party during the recent election there.
“Quebec gets $13 billion a year and we [Newfoundland and Labrador] get squat” said the PC Leader Ches Crosbie in a (funny and original!) campaign ad.
Despite such critiques, equalization is an important program at the centre of Canada’s approach to fiscal federalism. To some, it holds Canada together and, to quote Mary Janigan from her fabulous new book The Art of Sharing, is “vital to the survival of the nation.”
Unfortunately, misunderstandings abound. So it’s worth reviewing what the program is, what it isn’t, and how it works. Even among those engaging in good faith often see the program as complex and opaque. So to help, Finances of the Nation has developed a new first-of-its-kind tool to understand the program: an online equalization simulator!
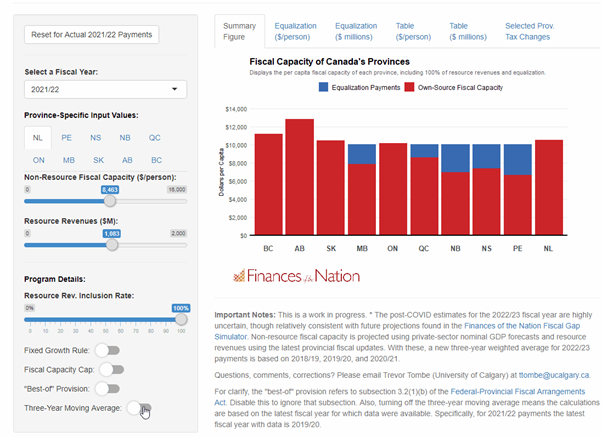
Finance of the Nation’s Equalization Payments Simulator
Explore one of the most important — though least understood — federal transfer programs with this interactive simulator.
We hope this tool will crack open the black-box and shed light on an important but often misunderstood program.
Let’s see how it all works.
Equalization: A Brief Primer
Regardless of where you live, we are committed (indeed, constitutionally committed) to ensure everyone has access to “reasonably comparable levels of public services at reasonably comparable levels of taxation.”
This is hard to achieve. After all, some provinces have lower incomes, fewer profitable corporations, more retired people, and lower productivity than other provinces. This makes it hard to fund government operations. A single percentage point of sales tax, for example, raises roughly $200 per resident in Prince Edward Island. But in higher-income Alberta that same point would raise 30% more — or nearly $260 per resident — thanks to higher average consumption spending there.
Averaging across all main sources of provincial tax revenues, Alberta can raise nearly 70% more per resident than Prince Edward Island could at similar tax rates. On top of this, Alberta enjoys significant resource revenues while Prince Edward Island does not.
In short, some provinces have a lower ability to raise revenues. We call this their “fiscal capacity.” Equalization — in its basic form — tops-up provinces with below-average fiscal capacity to the national average level.
Visually, Equalization payments are fiscal water poured onto provinces to raise their fiscal capacities to (approximately) the national average. For the 2021/22 payments, I plot this below:
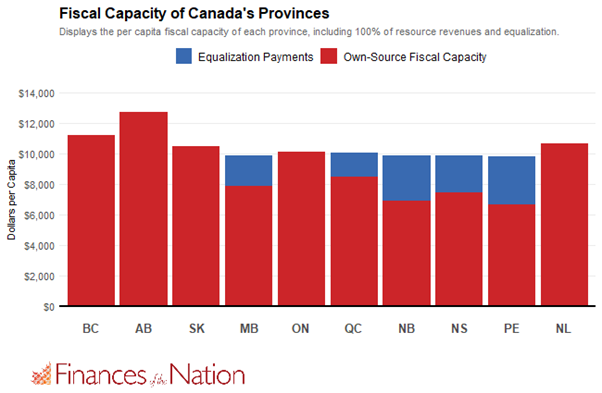
This intuition is straightforward, but there are a lot of complexities in the program and also reasonable debate between those hoping to reform equalization in different ways. The simulator reveals all of them clearly. Try it out for yourself!
Understanding the Bells and Whistles
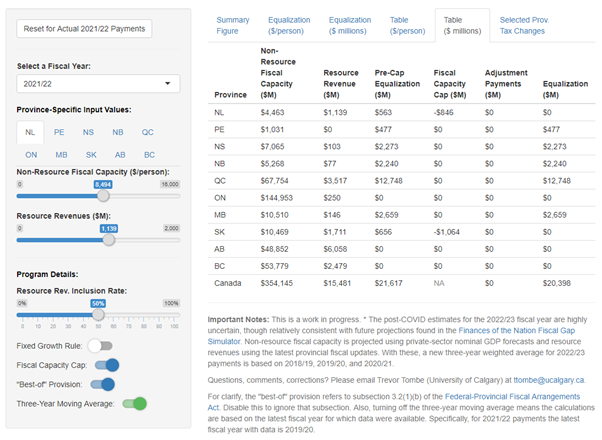
If all provincial revenues were included, and only the plain-vanilla intuition described above applied, then equalization payments in 2021/22 would total $20.7 billion — slightly less than the $20.9 billion actually paid.
Let’s see where those differences come from.
Three-Year Moving (Weighted) Average
Payments are determined not based on the most recent year for which data is available, but on a moving average that includes the three years of data. For practical reasons, there’s also a slight lag. The 2021/22 payments, for example, are based on the 2017/18 through 2019/20 fiscal capacity of each province, with 50% weight given to 2019/20 and 25% each to 2017/18 and 2018/19. This averaging would increase the size of the program to $20.9 billion, equal to its actual size this year. To see this, just click the button on the bottom left of the simulator and see the effect.
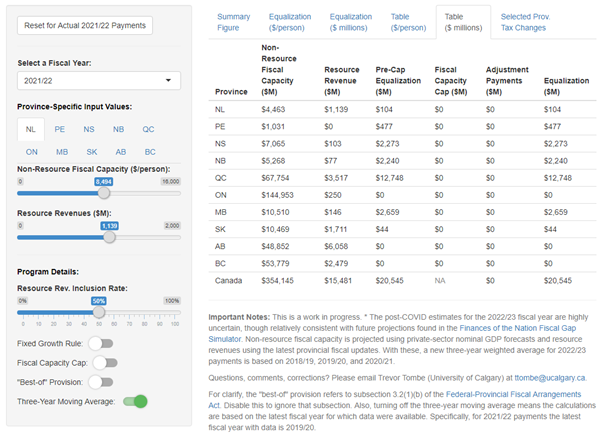
Partial Exclusion of Resource Revenues
Oil revenues, forestry stumpage fees, hydro revenues, and so on, are not taxes in the normal sense. So it’s more complicated to calculate “capacity” to raise revenue. We therefore include the actual revenues themselves directly in the program. But we do not include the full value of natural resource revenues collected (since that would be a disincentive to develop resource revenues in the first place). We instead include by default 50% of resource revenues. The simulator shows this would decrease the size of the program slightly to $20.5 billion. Just use the “inclusion rate” slider to see the effect.
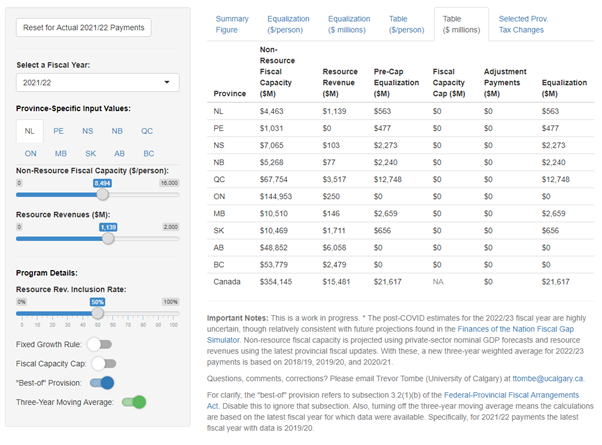
Best of 0% of 50% Resource Inclusion
In the 2006 federal election campaign, the Conservative Party campaigned on removing non-renewable natural resource revenues from the formula. This wouldn’t be ideal for a number of reasons, so the government includes a “best of” provision. At a certain stage in the calculation, provinces receive the larger of a payment calculated under 50% resource inclusion or 0%. This feature increases the program costs in 2021/22 to $21.6 billion.
The “Fiscal Capacity Cap”
Since equalization only partially includes resource revenues, there are situations where a recipient province could be better off than a non-recipient province. If just the above provisions prevailed, Newfoundland and Labrador, for example, would receive a $563 million payment or $1,072 per person. This would mean that the province’s total actual fiscal capacity (including all resource revenues) would exceed $11,733 per person. Ontario which wouldn’t receive a payment, would have a total fiscal capacity of just over $10,122. Some might consider this unfair, so the “fiscal capacity cap” lowers Newfoundland and Labrador’s payment to ensure this is not the case. It turns out, though, that the reduction effectively lower their payment to zero. Indeed, this is also the case for Saskatchewan, and is the only reason those two provinces didn’t receive a payment in 2021/22. This rule ends up shrinking the program’s size to $20.4 billion.
The “Fixed Growth Rule”
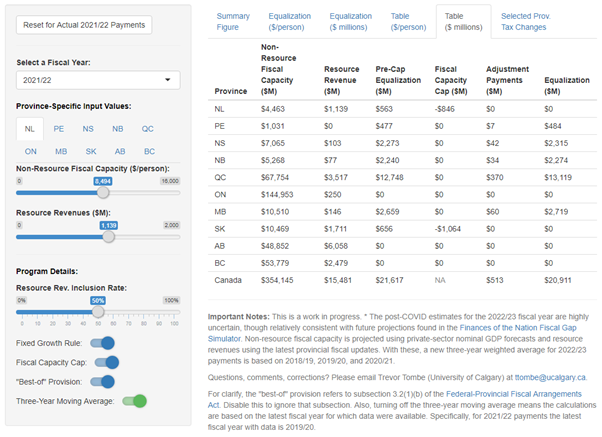
Starting in 2009, the law limits the amount of total equalization payments. This cap grows from one year to keep pace with Canada’s total economy. In effect, equalization can never be more or less than roughly 0.8% of GDP. For 2021/22, this meant $20.911 billion was available — or $513 million more than the $20.4 billion estimated above. The formula distributes these additional dollars to recipient provinces (and sometimes others, as I’ll explain below).
These are important complications to the program, and the simulator allows you to explore how they affect each province, in multiple fiscal years, and under a variety of other settings that you are free to choose!
Choose Your Own (Equalization) Adventure
The simulator is flexible enough to explore almost any economic and fiscal scenario you might imagine. You can change the fiscal year, turn features of the program on and off, adjust provincial resource revenues, adjust non-resource fiscal capacities, and even change some (selected) provincial policies — like a sales tax in Alberta or electricity prices in Quebec. For example:
- What happens if the equalization formula excluded all resource revenues? Quebec receives more ($13.5 billion instead of $13.1 billion).
- What happens if the formula excluded resource revenues and did not have a fiscal capacity cap? Newfoundland and Labrador and Saskatchewan would both qualify for payments. $556 million for NL and $639 million for SK.
- What happens if Alberta resource revenues decline to $3 billion and its non-resource fiscal capacity falls below $10,000 per person? Nothing. (Thanks to the fixed growth rule.)
- What happens if Alberta adopts an 8% sales tax? Not much.
- What would it take for Alberta to qualify? If its resource revenues fell to zero and its non-resource fiscal capacity declined 12% (to just below Ontario’s level), then it would start to receive adjustment payments.
- What happens if Quebec electricity prices increase by 1 cent per kWh? Its resource revenues increase significantly (Hydro Quebec produces well over 200 billion kWh of power per year, and this is a resource revenue). Its equalization payments consequently fall to less than $12.3 billion. Ontario, meanwhile, would qualify for $741 million in adjustment payments.
There are countless thousands of scenarios to explore. In a later post, we’ll use this tool to illustrate some potentially important challenges that COVID-19 and the resulting recession may create for the program’s future.
We hope this new tool will provide the insight needed to better appreciate how the program works and help Canadians guard themselves against misleading claims. And as new data arrives or program details change, Finances of the Nation will update this tool and keep you well informed.