
Tommy Gagné-Dubé, Luc Godbout and Suzie St-Cerny
The first part of this 2021 edition of the Bilan de la fiscalité au Québec presents the tax announcements made by the Québec and federal governments, and by those of the other provinces, since the previous edition of the report. The next two sections compare Québec against the other Canadian provinces in terms of taxation. The fourth section presents an overview of tax expenditures in Québec and evidences the choices made regarding the different sources of tax revenues. Then, two sections examine taxation from different angles, namely, households (net tax burden) and individuals (profile of Québec taxpayers). Finally, the last section looks at various indicators of income inequality and how governments reduce inequality through taxation.
This year’s edition of the Bilan de la fiscalité au Québec is based primarily on 2019 data and, as such, will serve as a pre-COVID point of reference. It allows taking stock of the taxation situation in Québec and in other provinces before the advent of this health and economic crisis.
Tax announcements in 2020
The tax announcements and news in 2020 were heavily influenced by what we might call COVID measures. Though six of the ten Canadian provinces,[1] including Québec, had already tabled their budget before the first wave of the pandemic, the number of tax announcements unrelated to the health crisis was nonetheless very high. However, as of mid-March, governments were focused almost entirely on the pandemic and its consequences, so much so that budgets and updates thereafter were dominated by COVID-19.
At the federal level, no budget was tabled in 2020. Aside from the extensive measures implemented in response to the pandemic, the Government of Canada still nevertheless make a series of major announcements concerning the digital economy in its Fall Economic Statement.
In Québec, the tax announcements unrelated to the pandemic were in keeping with those of the past two years: continuation and acceleration of the school tax reform aimed at applying a single rate province wide, the introduction of a series of measures to stimulate innovation among Québec corporations, and an overhaul and enhancement of tax credits for family caregivers.
Elsewhere in the country, several provinces lowered their corporate income tax rate, led by Alberta and Nova Scotia, which each cut their general rate by 2 percentage points. Where personal income taxes are concerned, British Columbia added a tax bracket for high-income earners. Regarding payroll taxes, Ontario raised its exemption threshold, as did Manitoba, to a lesser degree. As for property taxes, Ontario capped corporate property taxes in order to reduce certain sizeable disparities. Finally, in the area of consumption taxes, Manitoba planned to cut its retail sales tax from 7% to 6% before postponing the implementation of the reduction until further notice a few weeks later due to the pandemic. Several provinces subjected vaping products to a special tax.
Lastly, the subject of carbon pollution pricing remained front and central on the tax stage in the country. The decision to be rendered soon by the Supreme Court will be crucial in determining what happens next in this area of tax policy.
Below are the main findings that emerged when we compared the tax situation in Québec against the situation in the other Canadian provinces.
Tax revenue
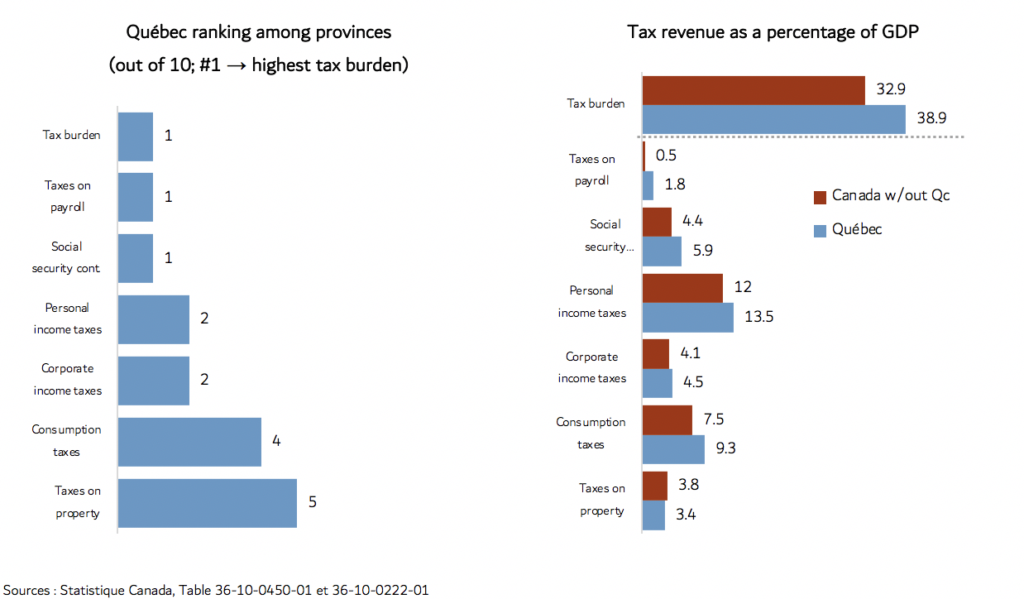
Within Canada, Quebec has the highest tax revenue as a percentage of GDP (38.9%, based on national accounts data sources), well above Canada without Québec (32.9%). In Québec, 49% of the tax revenue was raised by the provincial government, 33% by the federal government, and 9% each by local governments and pension plans. Québec stands out as the province with the smallest share of tax revenue raised by the federal government. The next lowest is 39%. Of course, the special Québec abatement explains this result in part. However, even without it, the share of the revenues collected would be 46% by the Québec government and 36% by the federal government, still the lowest share for the federal government in Canada.
How tax revenues are raised in Québec differs significantly from how they are raised on average in Canada and some differences have grown over time. For example, personal income taxes are on the rise in the rest of Canada (ROC) while they are on the decline in Québec, and the weight of corporate income taxes is rather stable in ROC while it is on the rise in Québec.
The charts below show how Québec ranks by source of tax revenue as a percentage of GDP against the other Canadian provinces. In the left-hand charts, the lower the rank, the higher the weight. In the right-hand charts, weights in Québec are compared against the weights in Canada minus Québec.
Among the Canadian provinces, Québec ranked 1st for total tax revenue and for payroll taxes and of social security contributions as a percentage of GDP. For corporate income taxes and consumption taxes, Québec came in second highest. Of the five sources of revenue indicated, Québec came in behind ROC only with respect to property taxes.
The ROC came in on the same side as Québec relative to the OECD average (above or below) in each revenue category, albeit to different degrees. In the end, Quebec’s tax burden was above the OECD average (33.9%), whereas ROC’s was below.
Figure 1 Tax Burden and Tax Revenue: Quebec and Rest of Canada
Tax revenues derived from environment-related taxes do not constitute a category of their own. They are generally lumped in with consumption taxes. In Québec and in Canada, these boil down essentially to gasoline taxes. Whether in terms of gasoline taxes or, more broadly, of environment-related taxes, Québec and Canada figured among the jurisdictions where these were lowest compared with the OECD member countries.
Tax expenditures
Tax expenditures are the result of tax decisions about how tax revenues are raised. Indeed, governments resort to tax expenditures to make economic or social interventions by way of taxation. Whenever a government sets up tax credits, deductions or exemptions within its baseline tax system, this reduces tax revenues.
Comparing the Québec and federal government on their main tax expenditures revealed many similarities. Ten of the 15 main tax expenditures of one government had a counterpart among the 15 main tax expenditures of the other.
Net tax burden
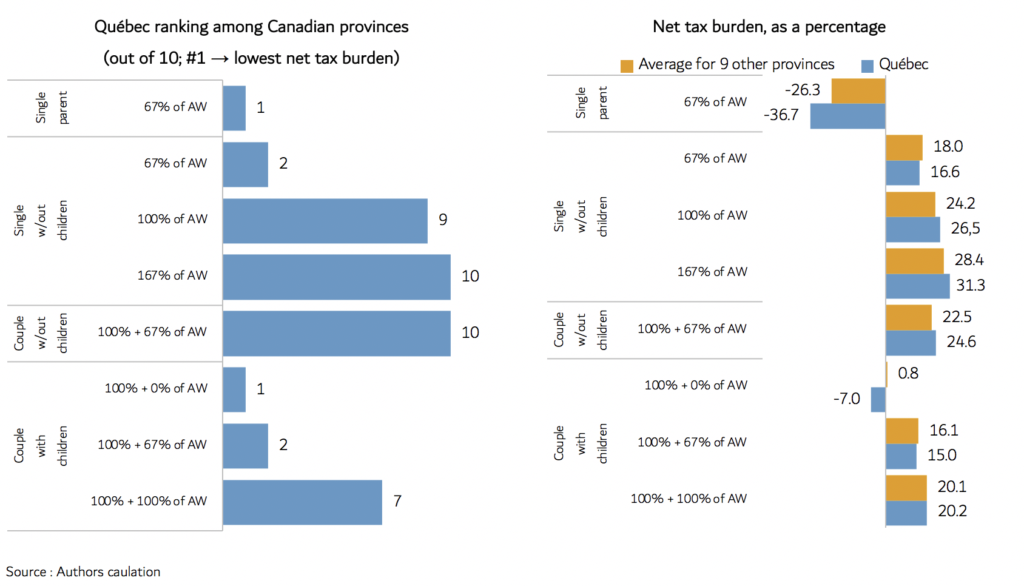
While indicators of tax burden and tax revenue sources for Québec show both total tax revenues and income taxes as a percentage of GDP to be rather high, analyzing the net tax burden sheds a finer light on the matter when, in addition to income taxes, social security contributions paid and benefits received are also taken into account.
To better understand and compare the tax burden faced by different types of households, we looked at eight different types of houesholds that differ in terms of income and number of dependents. This analysis shows that in many cases the higher income taxes are partially offset by such high received benefits. And, in some cases, the benefits received are higher than the taxes and contributions paid, resulting in a negative net tax burden.
Ranked among the Canadians provinces, Québec actually presented the lowest net tax burden in two of the eight cases analyzed, namely, single-parent families with two children earning 67% of the average wage (AW) in the province and couples with two children earning 100% of AW (in 2019, AW in Québec was $51,695).
For single persons earning 67% of AW, the net tax burden was 16.6%. Meanwhile, the rate for single-parent families with the same income was negative 36.7%. This is a gap of 53.3 percentage points. This result indicates that children are given tremendous consideration within Québec’s tax and benefits structure.
For couples with children earning 100% of AW (100% + 0%), the net tax burden was -7.0%. However, when these couples earned 200% of AW, the net tax burden rose to 20.2%, an increase of 27.2 percentage points. Here, the result shows the Québec tax system to be highly progressive. When Québec is compared against the other Canadian provinces, results essentially tell the same story, namely, that the net tax burden in Québec was either the lowest or among the lowest when family income was very low and families with children.
Figure 2 Tax Burden for Different Household Makeups
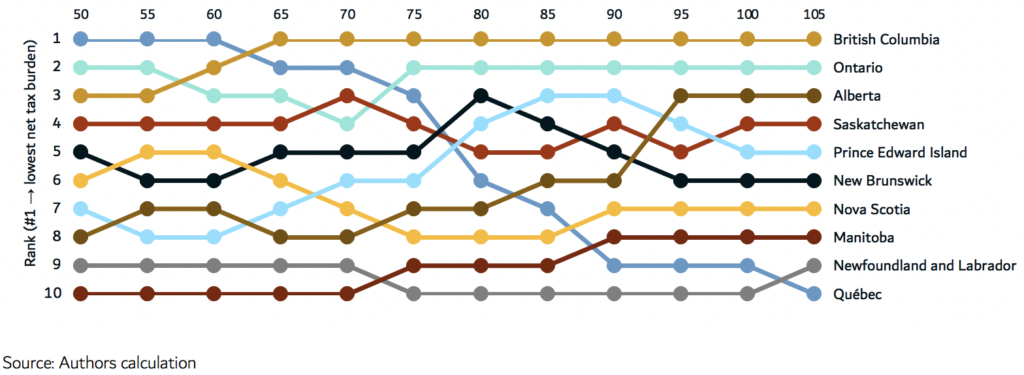
The graph below shows the evolution of the net tax burden for a single person. The evolution of Quebec’s net tax burden offers a remarkable change from the lowest weight to the highest when income increases from 50% of AW to 105% of AW. Alberta is going the other way from 8th place at 70% of AW to 3rd place where income reaches 105% of AW.
Figure 3 Province ranking, Single without children earning different level of average wage (AW) (Percentage of AW)
Profile of Québec taxpayers
Figure 1 Percent of taxable and no taxable returns, provincial income taxes, 2017 (as percentage of total)
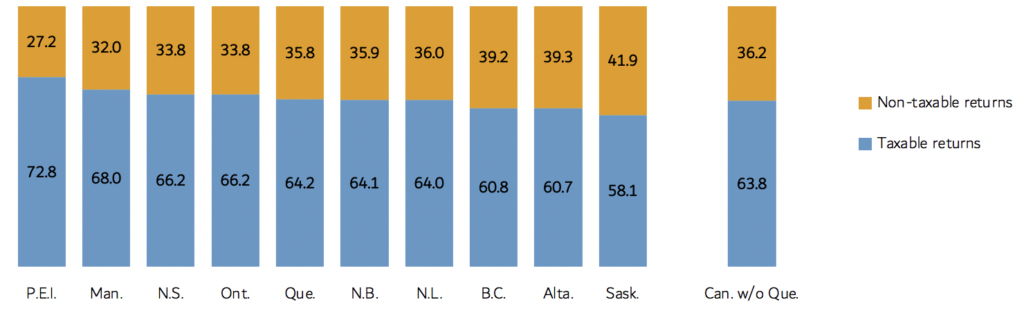
In 2017, the proportion of taxpayers that paid no provincial income taxes stood at 35.8% in Québec. This was not the highest proportion among the Canadian provinces, where it ran from 27.2% in Prince Edward Island to 41.9% in Saskatchewan. For the ROC, 36.2% of taxpayers paid no provincial income taxes.
Taxation and income inequality
Taxation can contribute to stimulate the economy, change how taxpayers behave, and reduce inequality. This last purpose is actualized in particular through a progressive income tax system and various tax measures intended to benefit lower-income taxpayers.
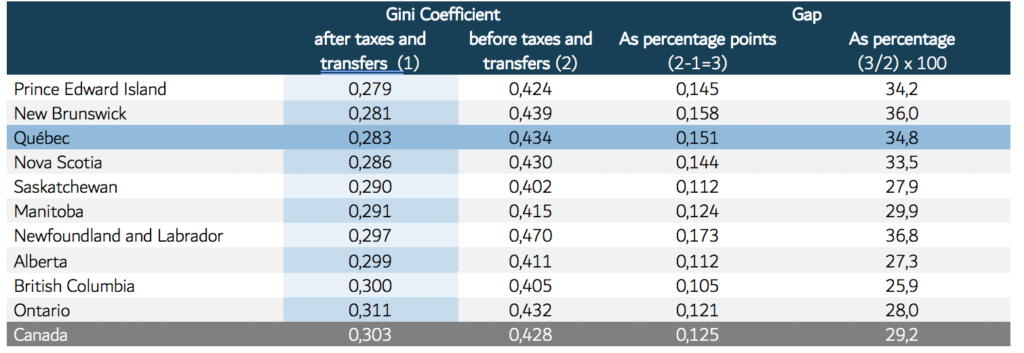
The Gini coefficient is another widely used indicator that allows us to gauge the impact of government intervention on income inequality. This indicator serves to compare market income (before taxes and transfers) and disposable income (after taxes and transfers). In Québec, government intervention reduced market income inequality by 34.8%, which was more than the average rate for Canada (29.2%).
Comparing the Gini coefficient for disposable income across Canada shows that Québec was the 3rd province with the least inequality, whereas it came in 8th based on market income. Furthermore, the data indicate that disposable income inequality has been lower in Québec than in Canada as a whole since 1976 and that the Gini coefficient for disposable income in Québec was lower in 2018 than it was on average from the mid-1990s to 2018. This suggests that inequality declined over the years.
Table 1 Gini coefficient, Canadian provinces, 2018
This report reviewed the key indicators most widely used in taxation analysis. What is presented here is some of the highlights of what can be found in the 2021 edition of the Bilan de la fiscalité au Québec (available in French).
[1] British Columbia (February 18), Nova Scotia (February 25), Alberta (February 27), Québec (March 10), New Brunswick (March 10) and Manitoba (March 11).