
By: Michael Smart
Municipal police budgets have been rising steadily in most major cities for many years, despite stable police employment and declining crime rates, and the average big-city resident pays $390 annually for the municipal police operating budget. The exception is Toronto, where police employment and per capita spending have been declining since 2010. While by no means “defunding the police,” Toronto has had moderate success in controlling police budgets in recent years. Despite budget reductions, criminality and crime clearance rates continue to evolve similarly in Toronto and other big cities.
Recent controversies around police behaviour directed at Indigenous and Black people in Canada and the United States have led to popular protests and widespread calls to “defund the police”.
Which begs the question: How do we now fund the police? Given Canada’s data gaps, this is not an easy question to answer.[1] To find out, we must turn to annual financial reports issued by provincial governments and – in Quebec and British Columbia, where data reporting is comparatively poor – to municipal budget documents.
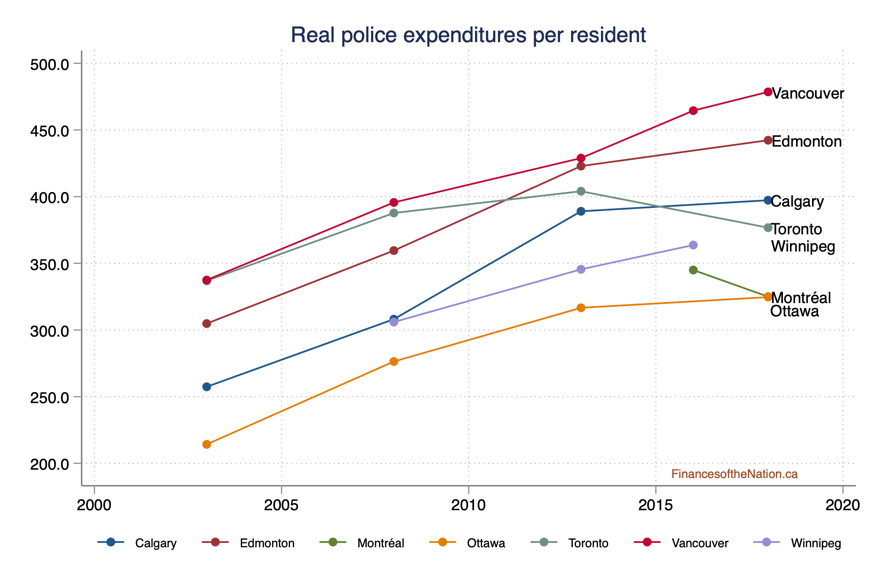
Figure 1 shows operating expense of municipal police forces in the seven cities every five years since 2003, divided by city populations to make them comparable, and expressed in inflation-adjusted real 2019 dollars. (Data are not available for some cities and years.) These data may not be fully comparable between different provinces. As well, the data reported here are from police operating budgets alone, and so expenditures on police buildings, vehicles, and other equipment are underreported. But these data are the best we have at present.
Police budgets are rising in real terms in most cities, reaching $390 per resident on average in 2018, about 30% higher in real terms than 15 years earlier. Including federal and provincial government expenditures, total policing costs amounted to about $15 billion in 2018, or $475 per capita. In comparison, primary and secondary public education cost the average Canadian about $2800. So policing is a substantial component of government in general.
Among the big cities depicted in Figure 1, the outlier is Toronto, where per capita spending peaked early in the last decade and has been declining ever since. Controlling the Toronto police budget has been a hard slog for politicians. The trend began under Mayor Rob Ford (who had a notoriously complex relationship with the police) but has continued under successive administrations. The city has flatlined the police budget for the past decade around $1.1 billion in inflation-adjusted terms. But population growth led to the per capita expenditure decline. While that is an exceptional change in itself, there are of course calls for deeper cuts and more fundamental reforms.
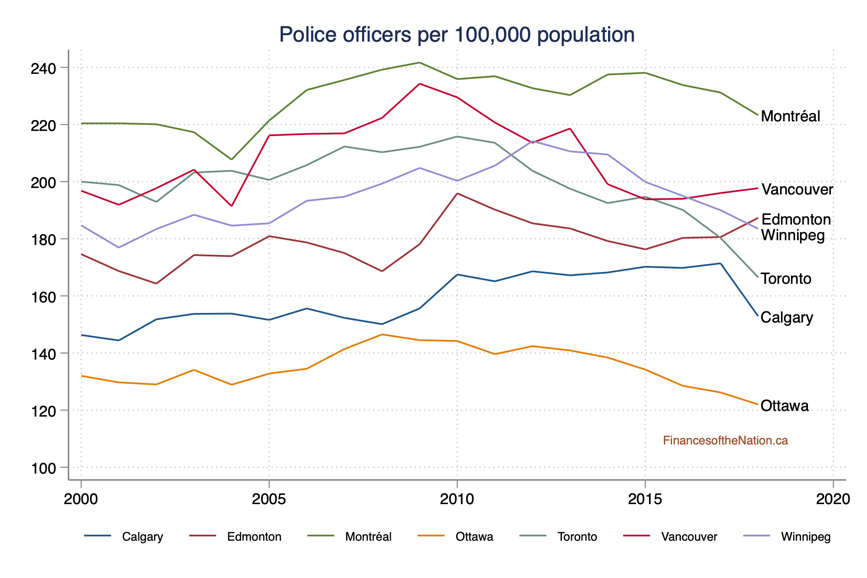
Statistics Canada does collect data on police staffing for most municipalities through its annual Police Administration Survey. Figure 2 shows trends in the number of (sworn, not civilian) police in each of the seven largest cities in the country from the StatCan data. Staffing ranges very widely across cities, from 122 sworn municipal officers per 100,000 in Ottawa in 2018 to 225 officers in Montréal. Police forces are larger on average in Western cities, where Indigenous population is higher.
Staffing rates have been steady in most cities, again with one notable exception. Toronto’s staffing rate has fallen about 25% from its peak in 2010 to just 166 officers per 100,000 residents in 2018. (Winnipeg and Vancouver have also seen declines in staffing, but these have not been nearly as large or as sustained as Toronto’s.) This reflects Toronto increasing population, but also very substantial reductions in the absolute number of police.
We can combine the staffing and spending data to calculate costs per police employee. Police operating budgets comprise mainly remuneration costs. In most cities, staffing is stable and budgets are rising. So average police salaries are rising, even in inflation-adjusted terms. Since Ontario municipalities report remuneration expense separately, we can calculate that Toronto and Ottawa police remuneration per (sworn plus civilian) employee rose 75% in inflation-adjusted terms between 2003 and 2018.
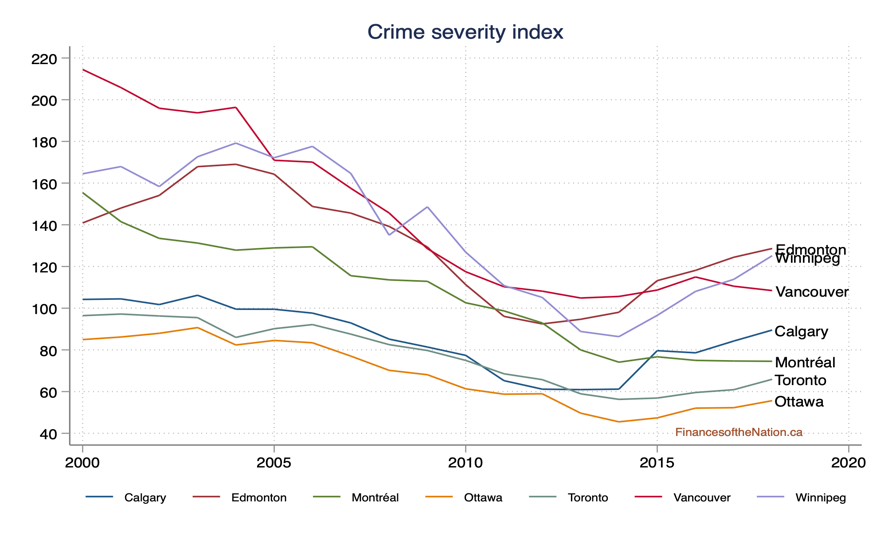
The steady rise in police budgets in most cities has occurred despite the continued decrease in crime rates. Figure 3 shows trends in StatCan’s Crime Severity Index, an average crime rate weighted by sentence lengths. The secular decline in crime rates is a decades-long phenomenon that likely reflects the aging of the population and perhaps other factors. The rise in crime rates since 2015 is more puzzling, but the same phenomenon has been observed in the United States and Australia.
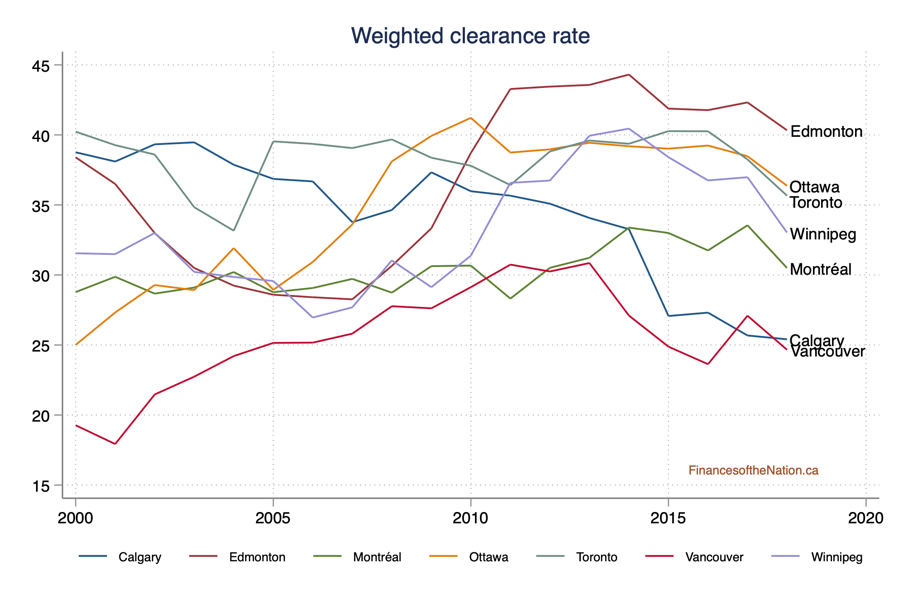
Toronto’s budget and staffing cuts have been made without apparent impact on police effectiveness. As shown in Figure 3, crime is evolving similarly in Toronto as in other cities where police budgets continue to grow. Figure 4 reports the percentage of reported crimes leading to an arrest for the seven cities, weighted by crime severity, a measure known as the weighted clearance rate. Clearance rate is an imperfect measure but it is generally accepted as a high-level metric for police performance. Again, Toronto’s clearance rate has remained steady around 35% to 40% over time, much as in most other major cities.
The data tell a simple story. Police budgets are rising in most big cities, while police employment remains steady, despite the general decrease in crime rates. In Toronto, as population grew over the past decade, the police budget has been held constant and police employment has declined. This led to substantial cuts in spending and staffing per resident, but no differential change in broad measures of police performance. Toronto’s example, while exceptional, perhaps shows one path to gradual “defunding” of police.
The data for the figures in this post are available here.
[1] Most police forces are agencies of municipal governments, which collect and report data in different ways. While some provinces do provide standardized financial reporting for their municipalities, there is no single source of information for the whole country. So comparisons of police funding across cities and over time are hard.