

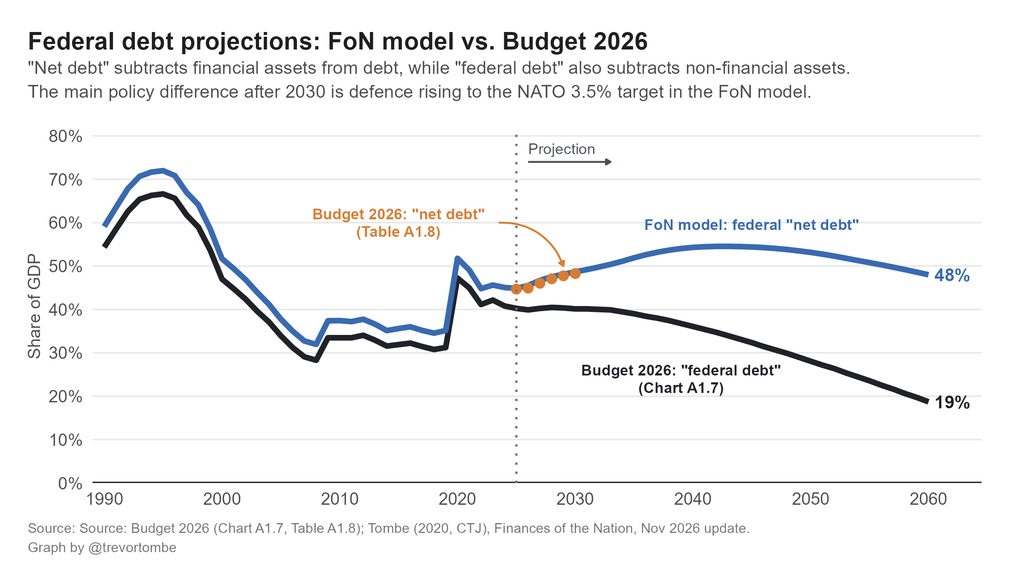
Budget 2026 projects federal debt falling from about 40% of GDP today to 18.6% by 2060–61. The Finances of the Nation (FoN) debt sustainability simulator projects federal net debt near 48% of GDP in 2060. What’s behind the large difference in outlooks for federal finances?
Two assumptions account for nearly all of the gap: which measure of public debt is used, and whether defence spending rises to Canada’s NATO commitment.
The two models in brief
Both projections have a lot of similarities. Any model of this kind will look at each revenue and spending component of federal finances and project them forward based on demographic, population, inflation, and other economic drivers. Any imbalance between revenues and spending will accumulate into either a rising or falling debt trajectory.
Both models grow nominal GDP by about 3.5% a year from 2031 to 2060, though the Budget assumes 0.9% annual productivity growth and the FoN simulator 1%, with StatCan’s M1 demographic projection. Both grow tax revenue with nominal GDP, index OAS and the Canada Child Benefit to the relevant population and inflation, and grow major transfers with their legislated escalators.
The starting points of the two models are a bit different, though. The Budget follows its own fiscal plan to 2030–31; the simulator projects every year from 2024–25 data. The Budget grows direct program spending with nominal GDP, while the simulator freezes it to 2030 (roughly in line with recent federal budgets) and then grows it with inflation and population thereafter. The Budget assumes no further increase in defence after 2030–31, while the simulator raises it to the NATO target of 3.5% of GDP by 2035. And the Budget assumes a 3.3% interest rate on market debt, against 3.0% in the simulator.
Most of these differences, though, don’t really matter as they roughly cancel out. But there are two key differences driving the divergence over the coming decades. They’re worth a slightly closer look.
Difference 1: federal debt versus net debt
Federal debt, the Budget’s headline series, equals net debt (liabilities less financial assets) minus non-financial assets such as buildings, equipment and infrastructure. The distinction matters more than usual in this budget. Under the Budget’s fiscal plan, non-financial assets rise from 4.5% of GDP in 2025–26 to 8.2% in 2030–31. This is a large increase that creates a growing gap between “federal debt” and “net debt.”
On the Budget’s own net-debt figures (Table A1.8), the ratio rises from 44.7% to 48.2% over those years. The FoN simulator gives 44.9% and 48.6%. Measured the same way, the two projections agree through 2030 (the orange dots in Figure 1). You can see this in the figure above, where the FoN simulator aligns quite well with the Budget’s own figures, despite not explicitly targeting them.
Difference 2: defence spending after 2030
Canada has committed to NATO’s target of 3.5% of GDP in core defence spending by 2035. The Budget’s long-run baseline grows direct program spending, defence included, with nominal GDP after 2030–31, so defence stays at its 2030–31 share. The Budget lists “additional defence spending” among the future pressures its baseline leaves out.
The FoN simulator assumes the commitment is met. Because NATO counts some spending that Statistics Canada records elsewhere (about 0.5% of GDP in 2024–25, such as military pensions and equipment). Holding defence at its 2030–31 share instead lowers projected 2060 net debt from 48% to 28% of GDP.
Bottom line
On comparable measures, the two projections agree closely through 2030. After that, the gap is mostly due to one important policy issue: whether defence rises to the NATO target. A projection that includes it shows federal net debt near 48% of GDP in 2060, which reveals a more challenging long-run fiscal picture than the Budget implies, though the federal fiscal gap remains small (−0.3% of GDP over 50 years) under the simulator’s baseline.
And, of course, long-run projections are sensitive to assumptions. Readers can test their own in the simulator at https://financesofthenation.ca/fiscal-gap-simulator/, which provides for a wide variety of scenarios that you can explore.